Table of contents:
- Creating a report
- Adding columns to a report
- Adding sections to a report
- Adding filters to a report
- Previewing / Formatting a report
- Publishing a report
If you wish to enable self-service reporting for your account/tenant, please ask your 6clicks administrator to contact 6clicks support with your name/email, the tenant name, and the provision location (e.g., US, UK, AU) with that request.
Creating a report
Go to the Analytics module and click + Create > Report. Select the Self-Service View that relates to the data you wish to report on.
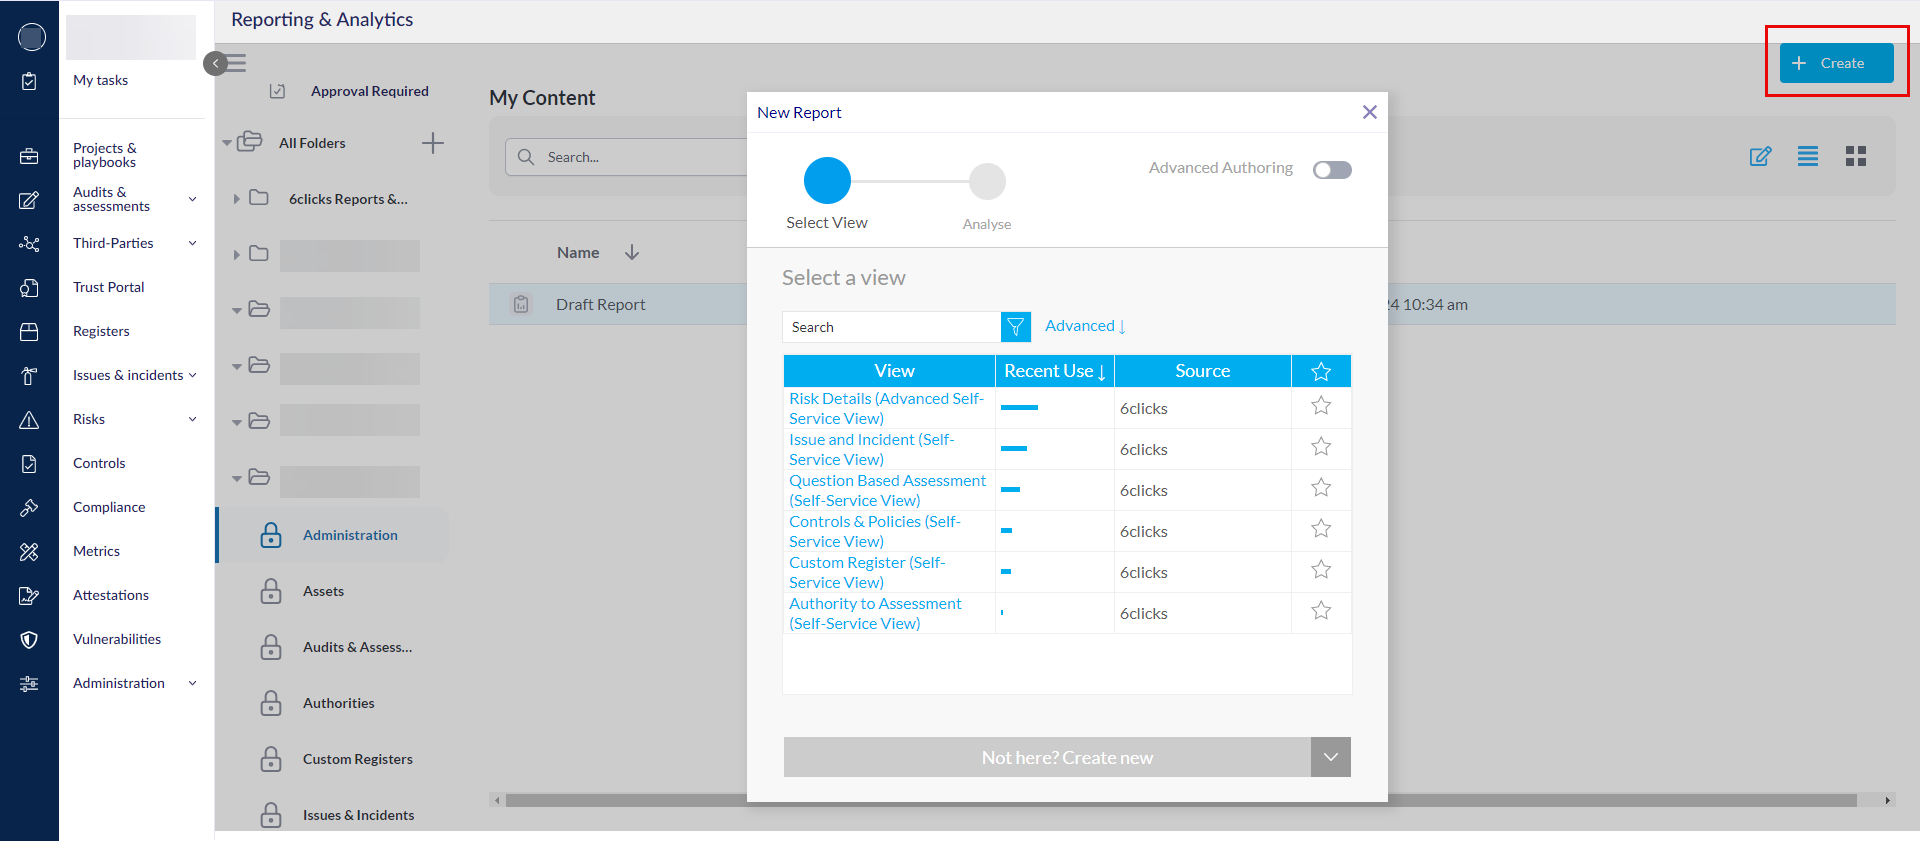
Choose the applicable view for your data. Below are a list of what they each include at a high level. To see whether the specific field you want to report on is included, hover over the view, select More Details and go to the Fields tab.
- Risk Details: Risk details, Risk users, Risk domains and tags, Risk linkage lists, Risk assessments (including matrix-related fields), Risk treatment plans, Risk custom fields, Risk activity (i.e. history/trail), Filters, Metrics, IDs
- Issue and Incident: Issue details, Issue linkage lists, Issue actions, Issue custom fields, Filters, Drill-downs
- Question-Based Assessment (QBA): Assessment overview, Assessment template, Assessment domain, Assessment question, Assessment response, Assessment response answer, Assessment response review, Filters, Metrics, IDs
- Controls & Policies: Control set details, Control set version, Control details, Responsibility details, Responsibility task details, Responsibility task comments, Linked lists, Controls custom fields, Filters, Metrics, IDs
- Custom Register: Register details, Register record details, Linked lists
- Authority to Assessment: Filters, Audit, Authority (sources and targets), Custom fields of authorities (sources and targets), Assessment, Domain, Question, Answer, Metrics, Provision (sources and targets). For an example of a report using a similar view, head here.
We are always adding more fields and views to the self-service capability. If you have a specific request, please reach out to our support team.
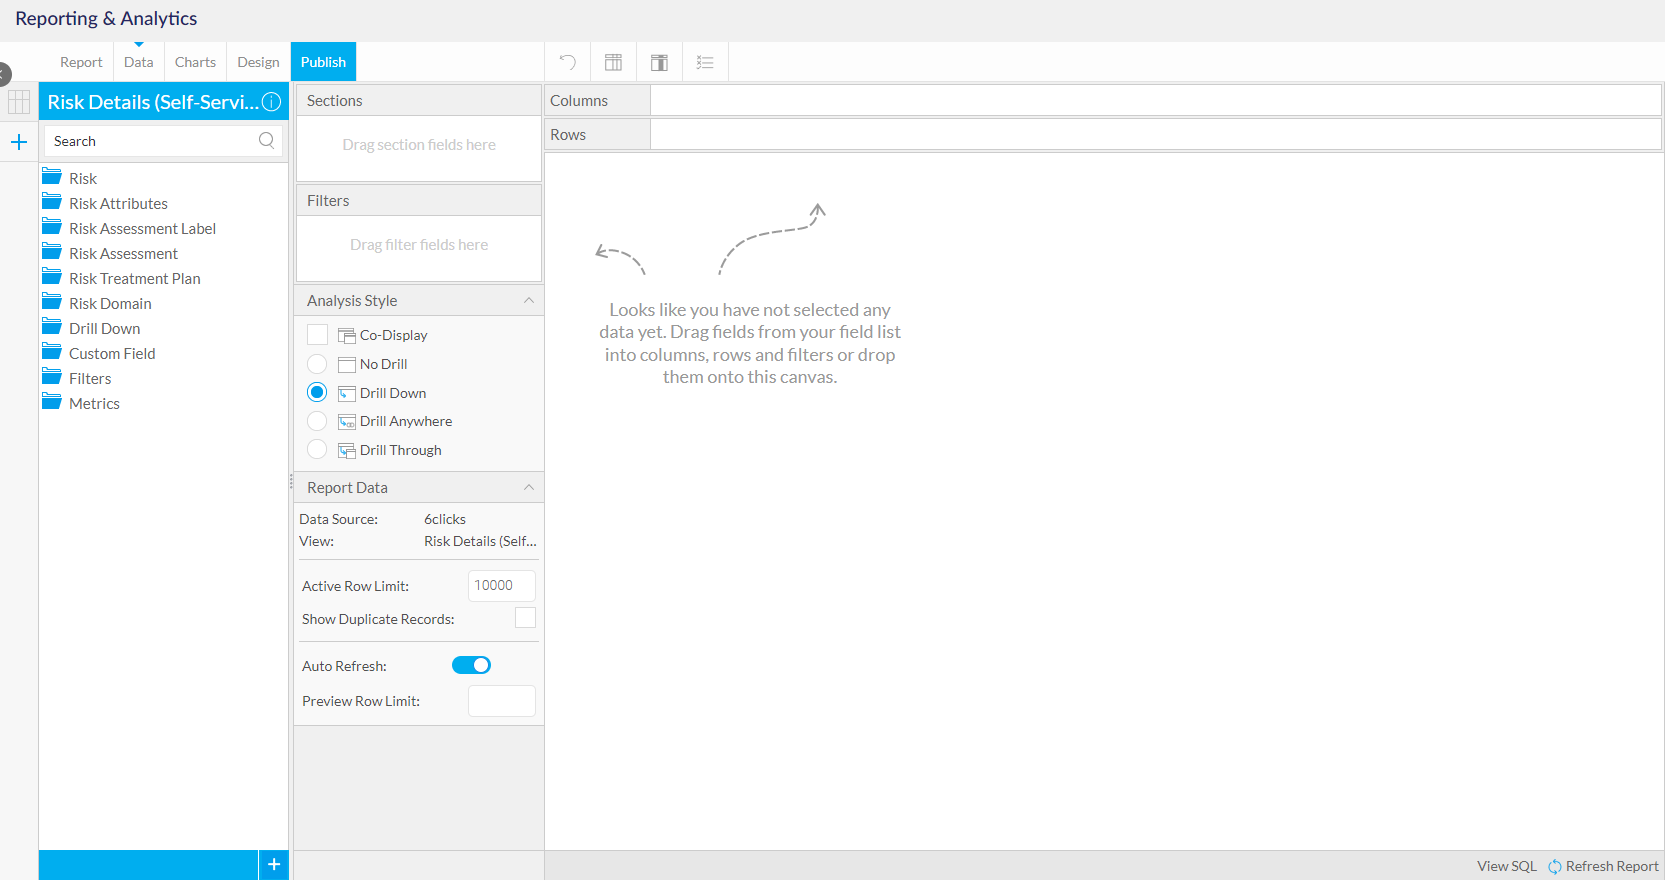
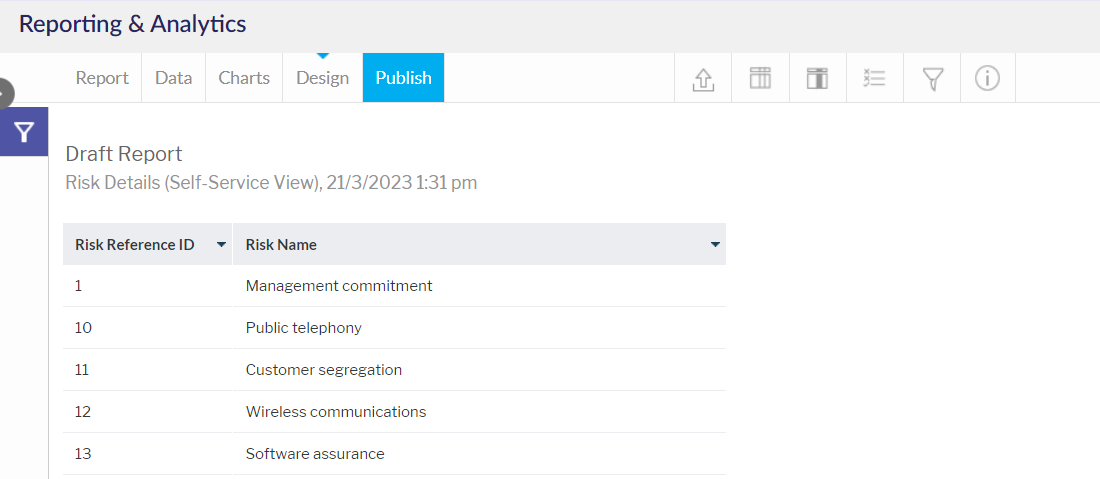
Once you have selected the relevant view, you will be taken to a draft report in the report builder.
Adding columns to a report
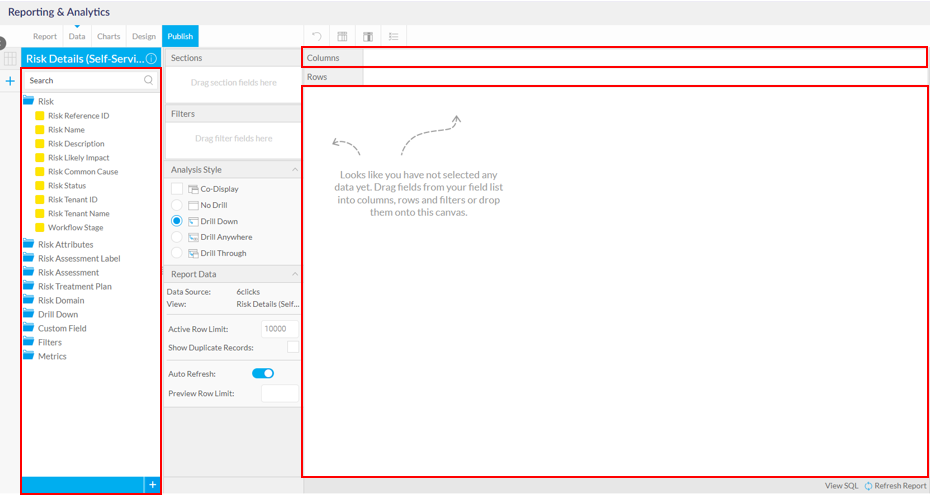
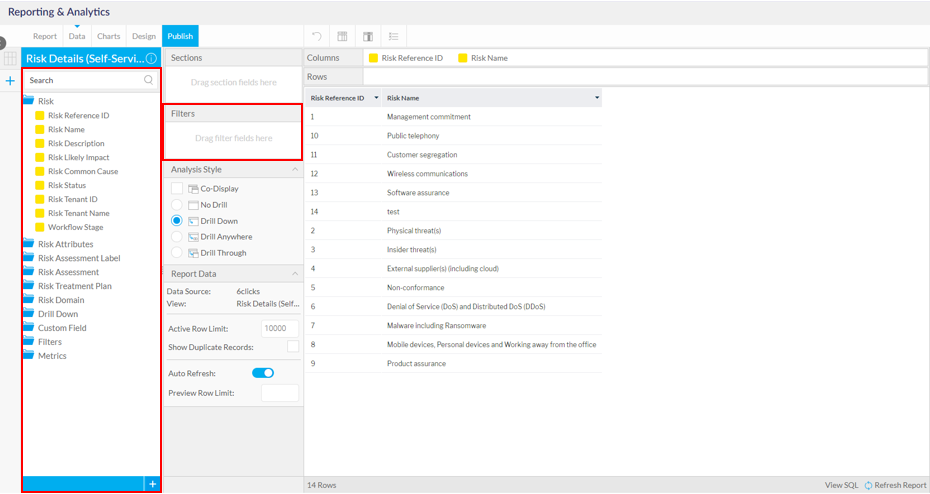
To start adding columns to the report, drag and drop the relevant fields from the left-hand panel into either the columns section or onto the canvas itself.
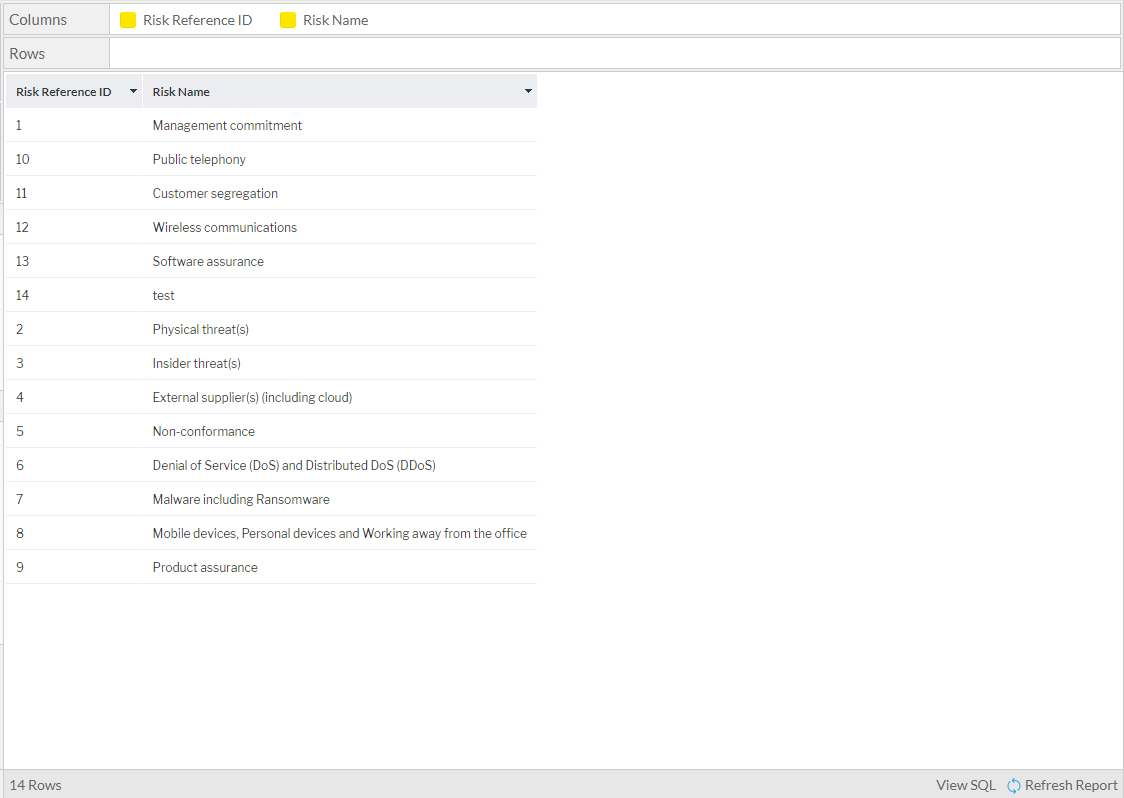
Columns will appear in the report as you drag and drop them.
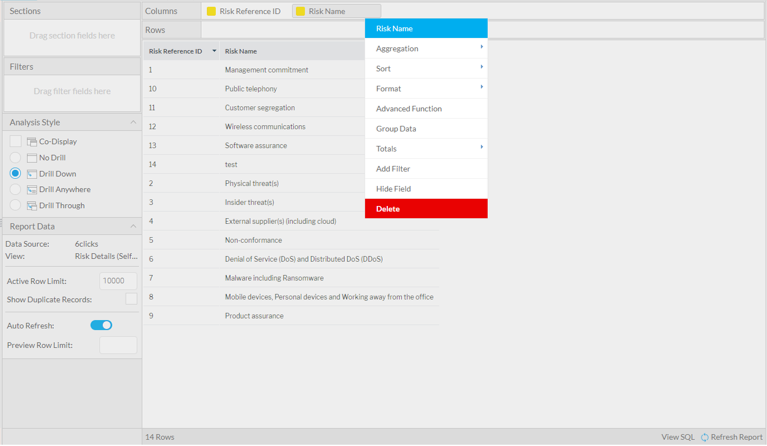
To remove a column, click the drop-down next to the column name and click Delete or drag it back into the list on the left.
Adding sections to a report
Sections can be added to reports to split tables and charts by one or more fields within 6clicks. To add a Section, drag a drop a field into the Sections area.
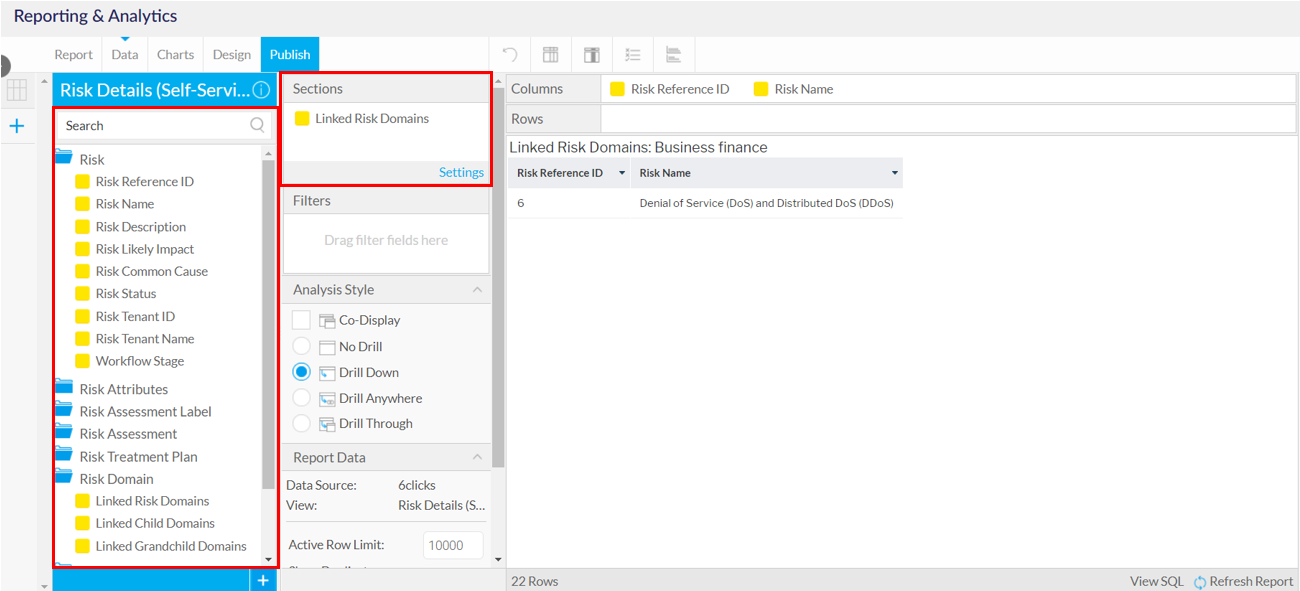
The Section will now appear within the report.
Adding filters to a report
Filters can be added to a report by dragging the relevant field into the Filters area.
Self-service views will often include pre-built filters. We recommend using these to save time.
Filters will automatically appear as they are added. Filters can be configured by clicking the drop-down next to filter name.
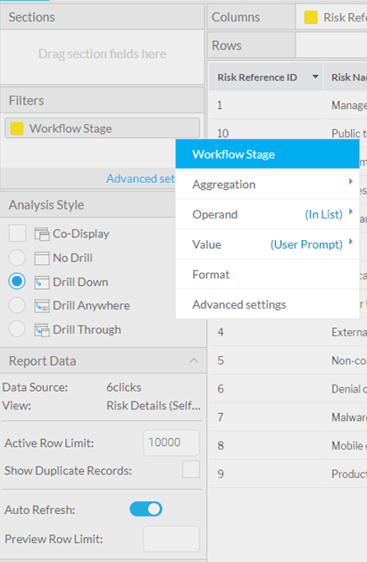
Operand settings determine how the report takes the input to filter the report. Common examples below:
- Is Equal - the filter will take one possible field value to filter the report
- In List - the filter will take multiple field values to filter the report
- Is Null - the filter will remove all Null values for the selected field
Value settings determine how input values are set when using the report:
- User Prompt - filter inputs are empty until defined by the report user
- Define Value - filter inputs are pre-defined with a string (text) input
- Search Values - filter inputs are pre-defined with a list input
Format settings include several other options to configure the filter. Common examples below:
- Description - relabel the filter (if empty, will use the default field label)
- Filter Requirement - set whether the filter is mandatory for the report to run
Filters can be tested by switching the draft report into Design mode. The next section will cover this.
Previewing / Formatting a report
Select the Design tab to preview the report.
This will show the report as it will appear when published. This includes the ability to preview and test filters.
This tab also provides the ability to fully format the report using the buttons at the top of the tab.
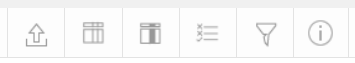
Formatting options include:
- Report Formatting
- Column Formatting
- Conditional Formatting
- Filter Formatting
Column, conditional and filter formatting is also available from the Data tab by selecting the dropdown next to a field within the report.
Publishing a report
Click the Publish button to save the report and make it available for other users.
If a report is previously published but currently has an active draft, it cannot be edited by other users.
The owner of the active draft can either abandon the draft or publish any changes to the live version to enable other users to edit the report.

A dialogue box will open to define key report details.
If your organization has RBAC permissions related to Analytics access, store your reports in their respective folders e.g. risk-related reports in the Risk folder, to ensure permissions are gating accurate access.
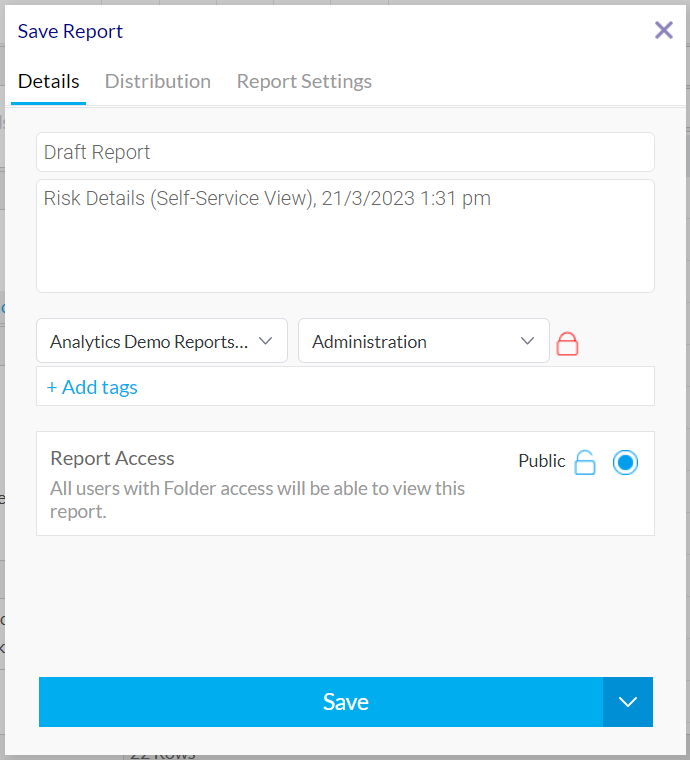
The Report Settings tab within this dialogue box contains settings for how this report can be used.
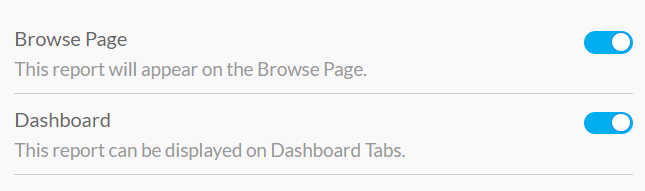
Click Save to proceed to publish the report.