Configurable dashboards
Learn how to configure the landing dashboard
This article is about dashboards in Spokes. For using the dashboard in your Hub, head here.
Table of contents
Where is it?
The dashboard is the first thing you see after logging into the spoke.
You can also click on the logo in the top left corner to go back to the dashboard from anywhere else in-app even if you have custom branding.

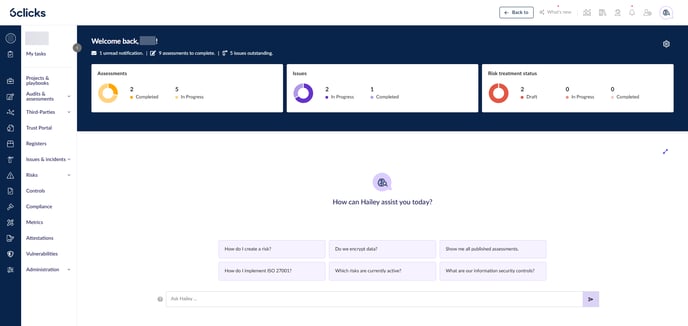
This is the default dashboard look.
Click the Configure dashboard cog in the top right corner to get started.
The below options will now be available.
- Edit layout: change the number and size of widgets
- Add widgets: Drag & drop different types of widgets into the current layout
- Edit or delete current widgets
- Edit header: configure the information displayed under the greeting
- Reset to default: undo all changes

- Cancel or Save
If you are an administrator or an advisor, you have some additional settings.
Layouts & styles
Select Edit layout to see the available layout options.
Select from the available grid templates and choose whether to highlight the top row in a banner. Your selection is saved automatically so you can close the Edit layout menu once done.
Widgets
Select Add widgets to see the available widget options.
Charts
After adding a chart widget, Edit the chart using the pencil to add data and set parameters.
You can configure the chart by the type of data (content area) & date range. You can also choose which fields to display.
Each part of the chart is clickable and can take you to the corresponding module and tab.
Hailey Assist
The Hailey Assist widget changes appearance depending on its size.
To learn more about Hailey Assist, head here.
Power BI report
Power BI reports cannot be placed in the smallest widget.
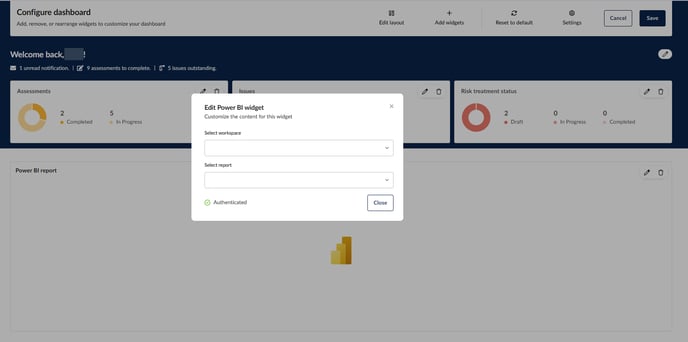
After adding a Power BI report widget, Edit the widget using the pencil. You will be asked to authenticate your Power BI account using your Microsoft credentials in a separate window.
Once you log in and authenticate, you can select a workspace and a report to display as a widget.

You can display any report you normally have access to in Power BI.
To learn more about 6clicks and Power BI, head here.
Text
After adding a text widget, Edit the text using the pencil.
Once done, click Close and the text will appear in the widget.
Administration
Set default dashboard for all users
As an administrator or advisor, you have access to the below additional dashboard settings.
Set as default for all users: Toggle this on so that the dashboard in your view will be the default dashboard for everyone.
Allow users to customize their dashboard: Toggle this off so that users cannot configure their own dashboards.
If both toggles are on, users will initially see the dashboard you configured for them, but they can edit their own views. In this case, if a user uses the Reset to default option to reset their dashboard, their view will go back to the dashboard you created (instead of the default 6clicks dashboard).
Permissions & visibility
Users without the necessary permissions cannot view the relevant widgets.
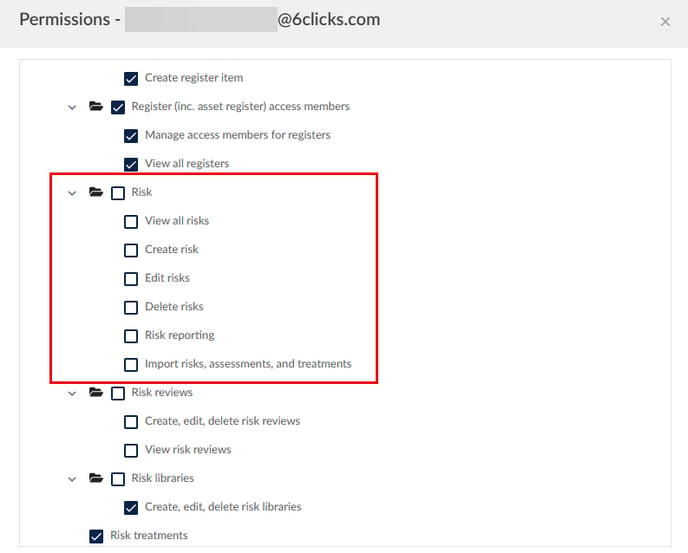
For example, here we have a user with no risk permissions.

This user cannot view the data displayed in risk-related chart widgets; however, they can view other chart widgets normally.


