Table of contents
Gettings started
Navigate to Analytics and select Create > Dashboard.

If the Create > Dashboard option is not visible, contact your 6clicks administrator or the 6clicks support team.
The Create New Dashboard modal will appear with the below options.

- Dashboard Name
- Default Data Set (optional) - if the dashboard will include only data from one view, select the view. For example, if this is a risk dashboard and all information included will be about risks, you may want to select Risk Details.
- Choose Layout - select the default layout of the dashboard when it is created. In this example, we are using the blank canvas layout.
Dashboard options
Once the dashboard has been created, you will be able to edit its Dashboard Properties using the menu on the right.
Switch between the properties for the dashboard and the sub tab using the toggle near the top. You can also minimize this menu to see more of the canvas.

Once you add more things to the canvas, you can edit their properties as well. For example, click on a filter to check its Widget Properties. Switch back to dashboard/sub tab properties by clicking on a blank area on the canvas.

The tools you can use to build the dashboard will appear on the left, including:

Sub Tabs
Here you can create, organize, or delete sub tabs which form the dashboard.
Create a new sub tab by clicking on the + button towards the bottom of the menu, or click on the 3 dots to the right of an existing sub tab to duplicate, move, or delete it.

Reports
Here you can search for reports and drag-and-drop them into the dashboard.

Once dropped into the canvas, you can resize the report as necessary.
Click on the report that is now on the canvas, and you will see 3 icons pop-up near its top right corner. These are:
- Transform - Copy, paste, align, arrange, delete... etc the report on the canvas
- More - Export, share, & information; these are shortcut actions not related to the dashboard, and you can perform the same actions within the standalone report
- Open report - a shortcut to access the report

If you open the report from the dashboard editor, you can Return to Dashboard by using the button in the bottom right corner of the report.

Filter
Here you can drag-and-drop either horizontal or vertical style filters onto the canvas.

You can then click on the filter on the canvas and add the necessary filter(s) for this dashboard by selecting from the existing filters for the reports on the canvas.

You can set the default filters that will be applied to the dashboard. First apply a filter and value.

Then set it as default by selecting + Filters > Set current values as default.

Remember to click Apply for the filters to take effect if Auto run filters toggle is off in Widget Properties.

If you have multiple reports on the same canvas, you can link their filters.
Text
Here you can add text boxes onto the canvas by drag-and-drop. First, drag-and-drop onto the canvas the size of the text box that you need, then edit the text.

Graphics
Here you can add shapes, lines, and icons to the canvas.

Images
This option allows users to insert images into the tab. Click Add Image and a modal will appear. Drag and drop or upload a file here.

Once the image has been uploaded it then can be dragged and dropped into the tab.
Widgets
Here you can add Code Widgets or Buttons to the canvas.

To add an action to a button, expand the Button Widget Properties to the right.

Publishing the dashboard
Under More, you can Refresh Dashboard and Delete Version.

Once you are done with editing the dashboard, click Preview Mode.

Publish the dashboard by clicking on Publish in the top right corner. Before publishing the dashboard, you can edit the following:
- Name
- Description
- Team & Folder - store your dashboard in a folder with appropriate access permissions in mind. In the below example we are storing the dashboard in the Administration folder which means the dashboard will not be accessible to users without the Analytics > Administration permission.
- Tags - these are only usable in the Analytics module and are not the same set of tags available in Administration > Custom data.

Reports and filters in dashboards
Creating a dashboard using reports from the same module
Dashboards are an effective way to showcase multiple reports on a single page. For example, you can create a dashboard by merging reports and tables related to the same module, such as combining the risk matrix with the risk treatment plan table to build a comprehensive risk manager dashboard. Since reports for the same module typically share similar filters and the dashboard supports only one filter at a time, combining these filters is straightforward.
As an example, let's create a dashboard and add Assessment Results (QBA) - by Results.

Next, add Progress Report (QBA) - Assessment - Overall Progress and select the Chart.

The next step is to add some filters. Drag a filter set onto the dashboard and click on it.
You will see these two options:
- Filters
- Link Filters

First, select the filters you want to display by clicking on Filters.
You will see in the pop-up that you can select filters from either report.
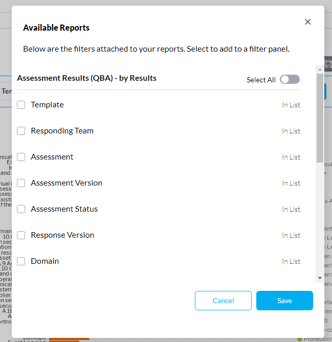
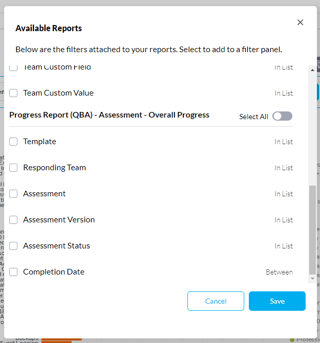
Since the filters from the reports are very similar, you only need to select filters from one of the reports (we will link filters in the next step).
Select the filters you need for the dashboard and click Save.
In this example, we will take the filters from Assessment Results (QBA) - by Results.

Click Save and the selected filters will appear on the canvas.

Next, we will link the filters of the second report to the first report. Click on Link Filters.

In the link filter pop-up, we will need to link the filters of the second report to the selected filters of the first report. The first filter we will match is called Template.
From the dropdown, under Existing Filters, we select Template.
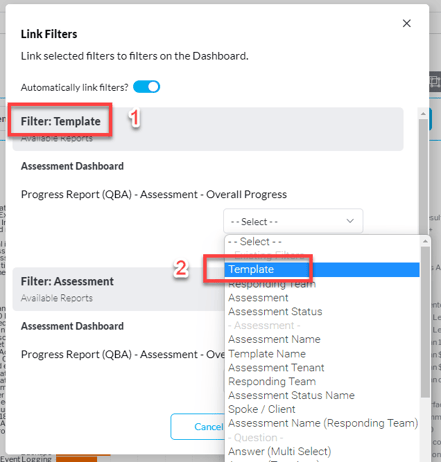
The same will need to be done for Assessment and Responding Team.
Remember to select from under the Existing Filters section in the dropdown.

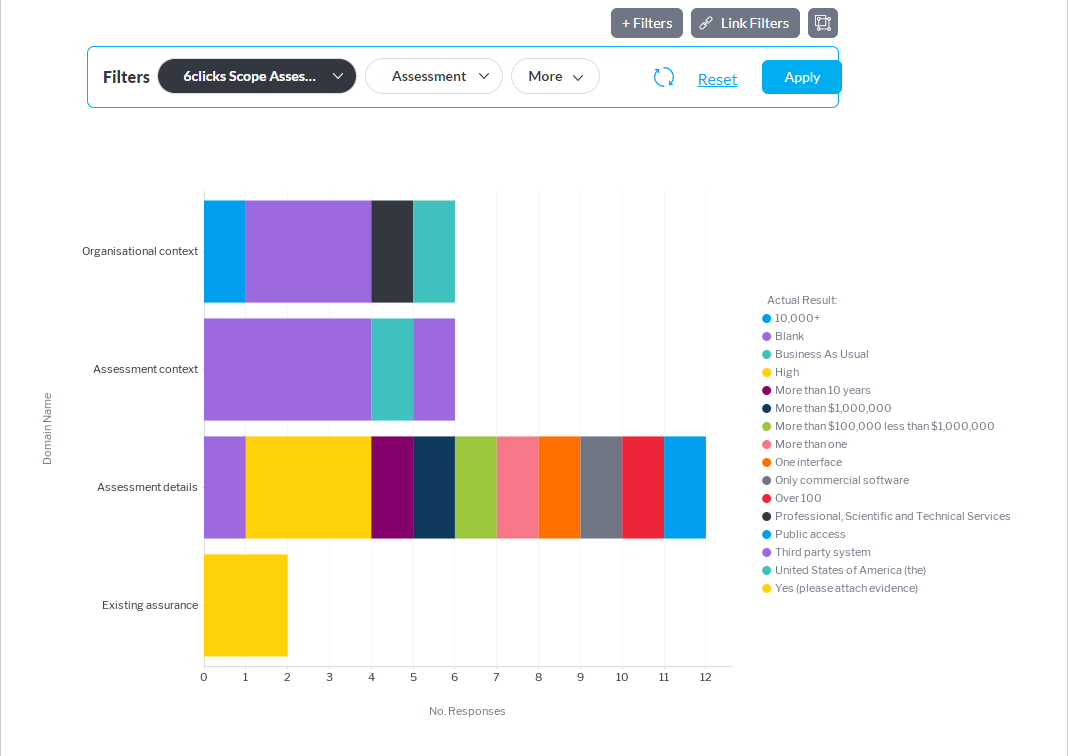
Click Apply and the filters of the second report (Progress Report (QBA) - Assessment - Overall Progress) are now linked to the filters of the first report (Assessment Results (QBA) - by Results). To test, apply some filters and view the updated report.
If you have a third report (in this example, we used Assessment Results (QBA) - by Risk), in the Link Filters pop-up you will see the option to select its filters to link to the filters used on the dashboard (from the first report).
Again, remember to select from under the Existing Filters section in the dropdown.

Creating a dashboard using reports from different modules
In this example, we will add both the Risk Matrix report and the Progress Report (QBA) - Assessment report.
To start, drag and drop a Risk Matrix report into the dashboard.

Drag and drop a Vertical filter which will be associated with the Risk Matrix.
Select + Filters > Filter.

Choose the filters you need and Save.

Then select + Filters again and this time, Set current values as default to save the current filter option(s).

Next, drag and drop a different report; in this example, we are going to use Progress Report (QBA) - Assessment.

An Automatic Filter Linking modal will appear, select Skip For Now.
If an error occurs saying that Automatic Filter Linking failed, ignore it.

Drag and drop a Vertical filter which will be associated with the Progress Report (QBA) - Assessment. Select + Filters > Filter.

Select the filters you need for this report.

Then select + Filters > Update default values to save the current filter option(s).

Now you can preview or publish the dashboard as normal, with the needed filter values selected by default.
To learn about broadcasting your new dashboard to others via email, head here.
To learn how to create custom reports so you can add them to dashboards, head here.