Table of contents
If you wish to enable self-service reporting for your account/tenant, please ask your 6clicks administrator to contact 6clicks support with your name/email, the tenant name, and the provision location (e.g., US, UK, AU) with that request.
This article specifically covers how to add co-display or drill-through reports to a self-service report. For guidance on how to access and use self-service reporting, please see this article.
Co-Display Reports
Co-Display Reports allow you to create a self-service report combining multiple tables and charts from different reports (including other data sources).
To add a Co-Display Report, check the Co Display checkbox in the Analysis Style section of the Data editor.
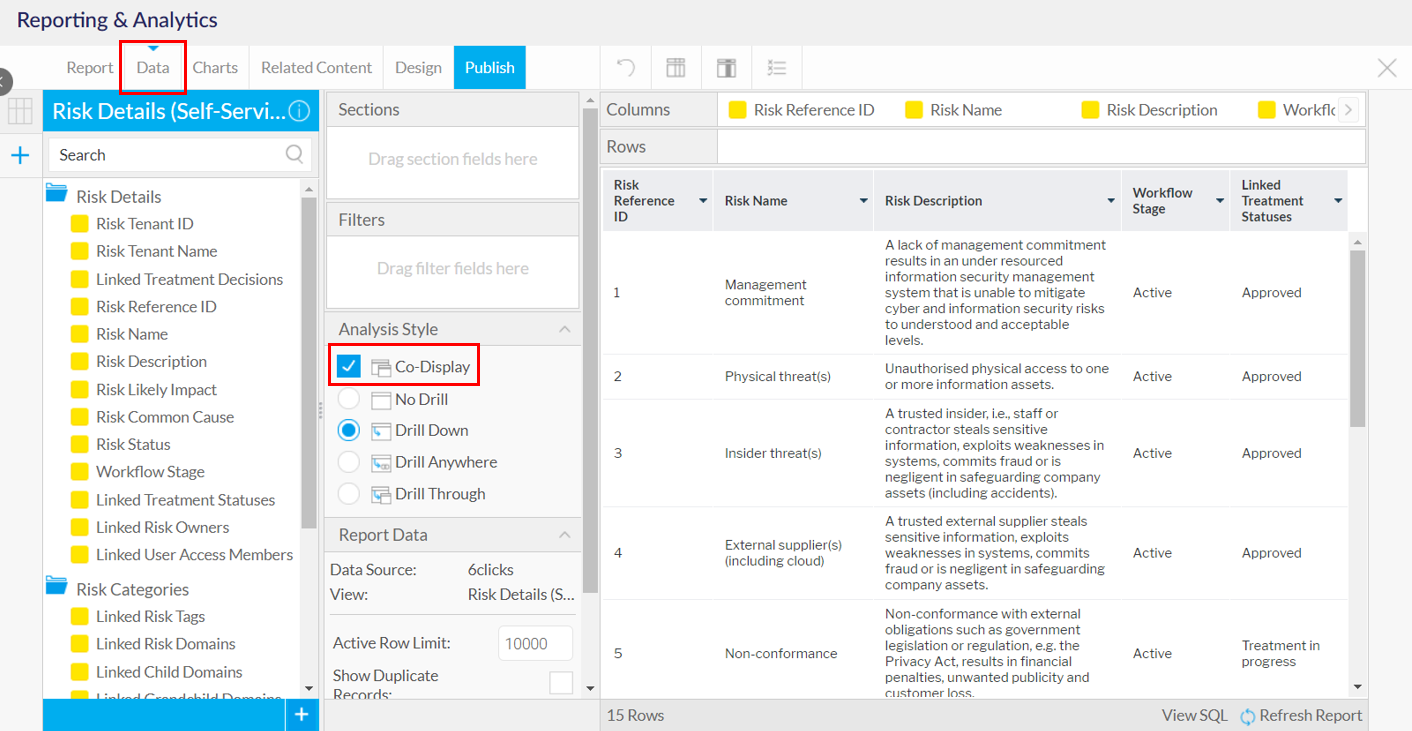
When checked, a new Related Content tab will appear. This tab allows you to add tables and charts from other reports to the current report in several ways.
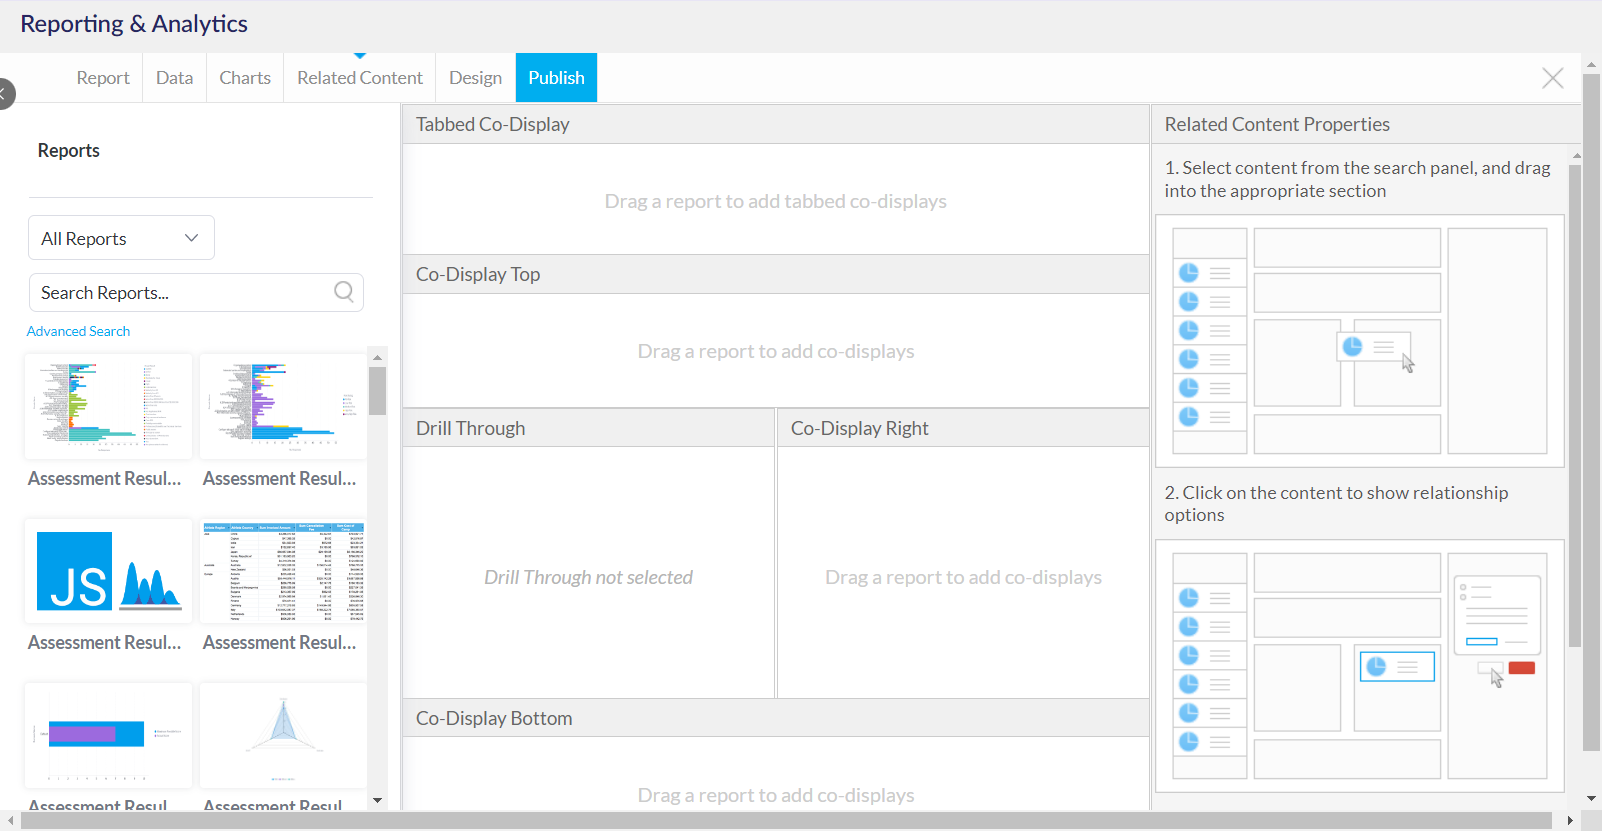
To add a Co-Display report, search and find the relevant report from the left panel and drag and drop it into the relevant section in the middle.
You can find hidden reports by clicking on Advanced Search and then toggle to show Hidden Reports.
Where you place the Co-Display will determine how it appears in your report.
- Tabbed Co-Display - adds reports as a tab to the current report
- Co-Display Top - adds reports above the current report
- Co-Display Right - adds reports to the right of the current report
- Co-Display Bottom - adds reports below the current report
Once you have selected the relevant Co-Display Reports, you can then define the joins between these and the current report.
To do this, select the Co-Display Report. This will open the Joins settings for that report.

From here, you can determine how the filters/fields from the current report (Master Filters/Fields) will link to the filters in the Co-Display Report (Child Filters).
Click Update once completed to complete the join.
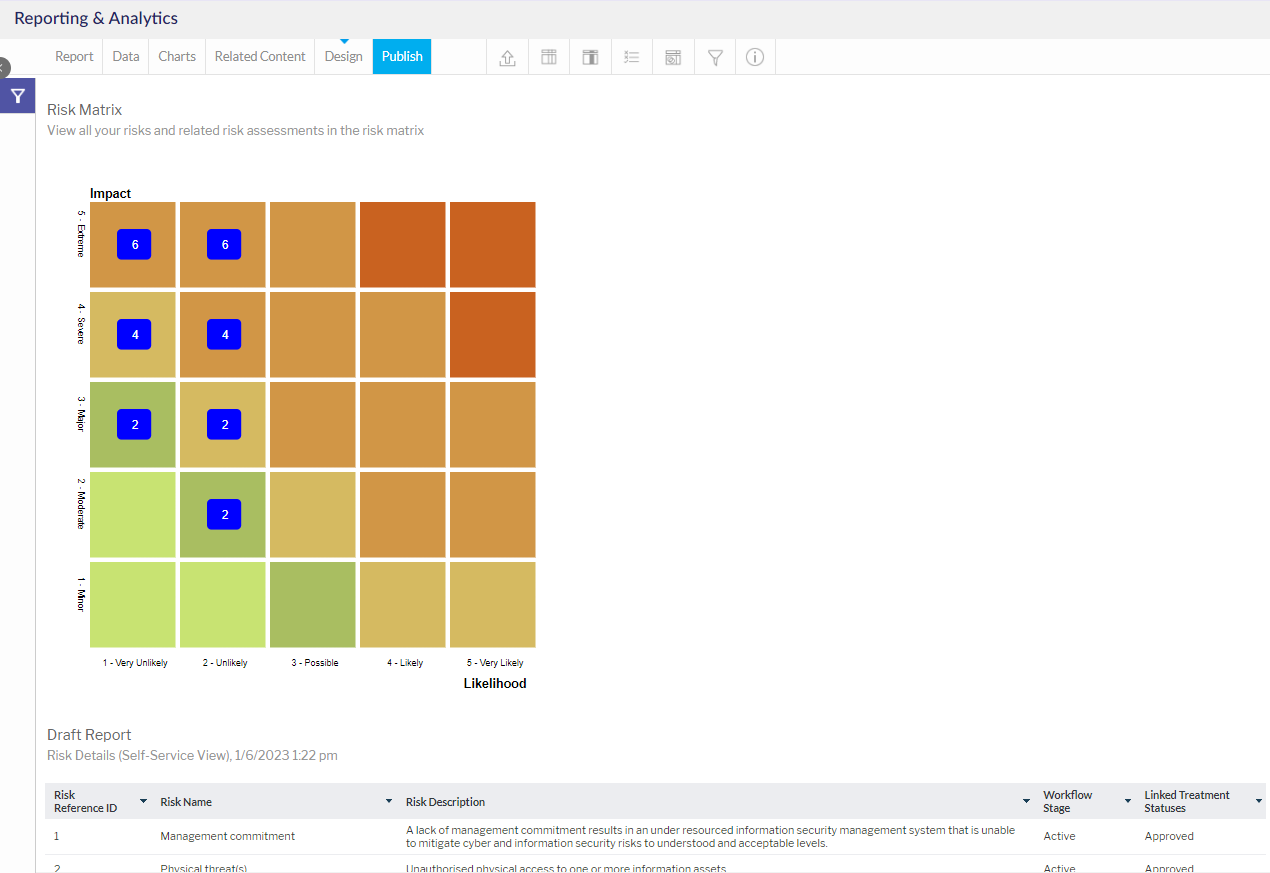
You can preview the results (including testing the join filters) in the Design tab.
Drill-Through Reports
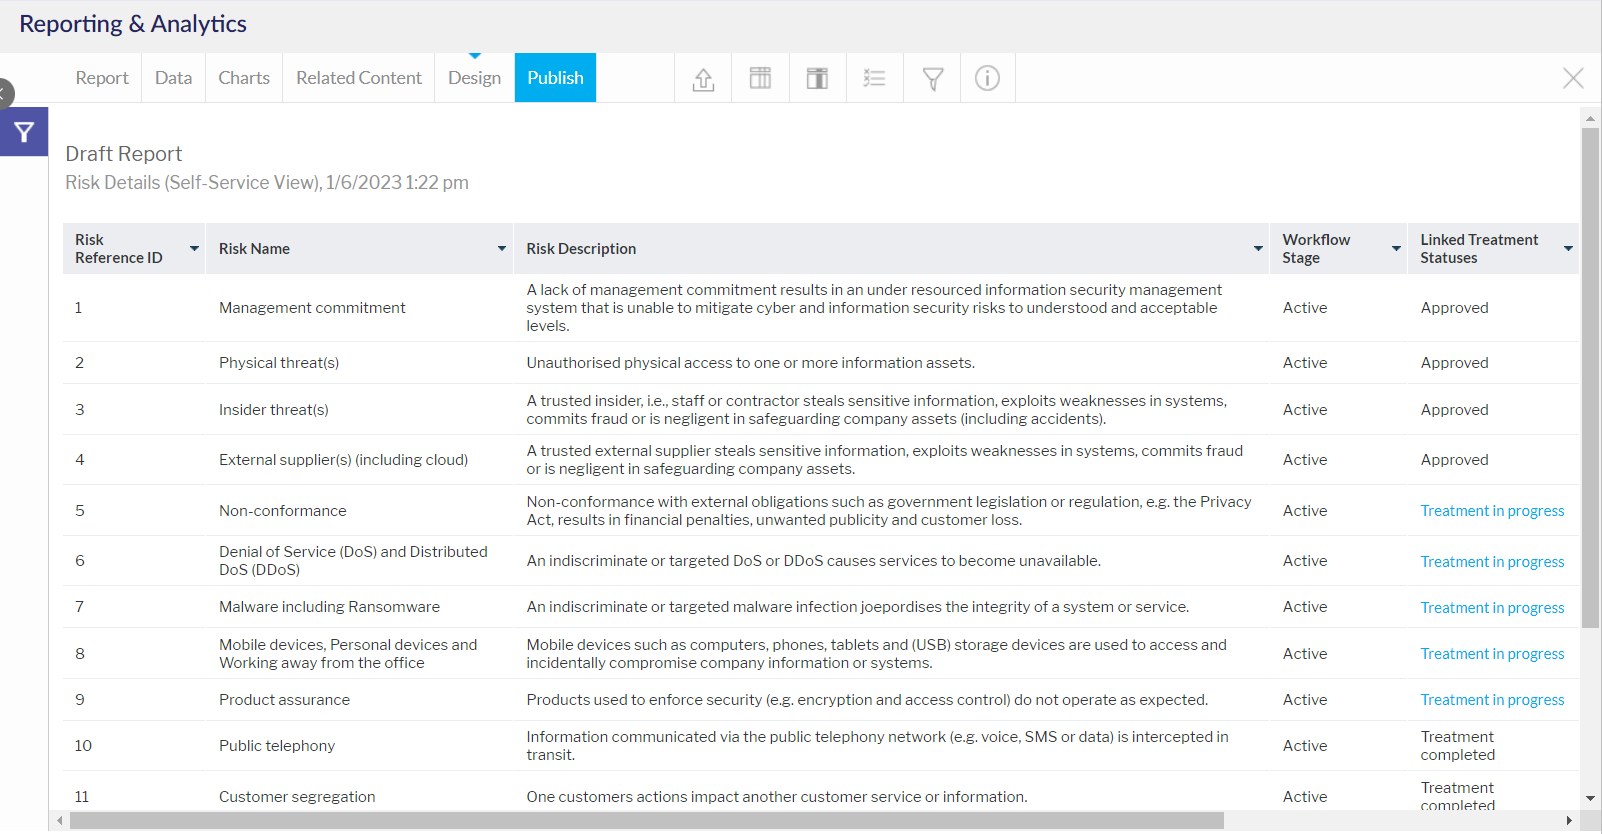
Drill-Through Reports allow for hyperlinks to be set up on tables and charts that will open new reports to show further information. Below is an example from a standard 6clicks report.
To add a Drill-Through Report, select the Drill Through radio button from the Analysis section in the Data editor.
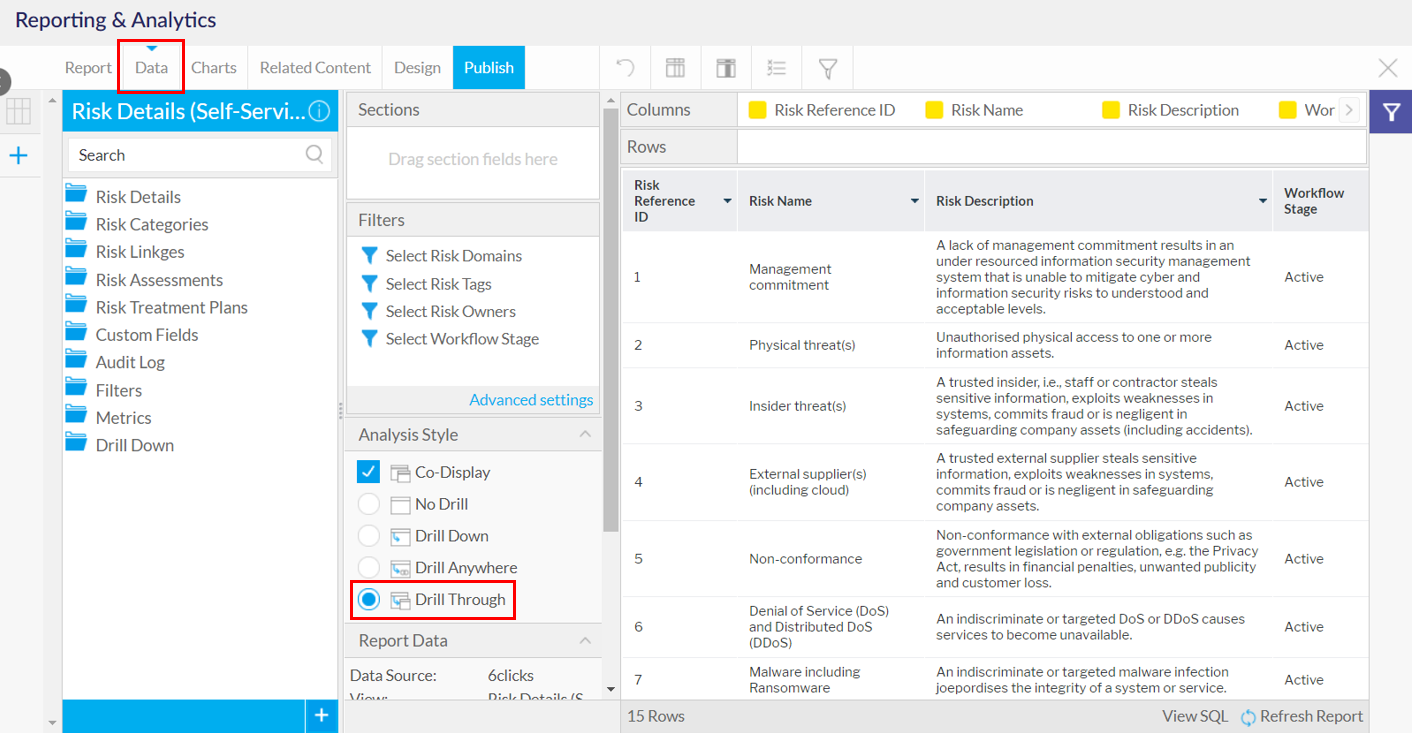
When checked, a new Related Content tab will appear. This tab allows you to add tables and charts from other reports as Drill-Through Reports.

To add a Drill-Through report, search and find the relevant report from the left panel and drag and drop it into the Drill Through section in the middle.
You can find hidden reports by clicking on Advanced Search and then toggle to show Hidden Reports.
Once you have selected the relevant Drill-Through Reports, you can then define the joins between these and the current report.
To do this, select the Drill-Through Report. This will open the Joins settings for that report.
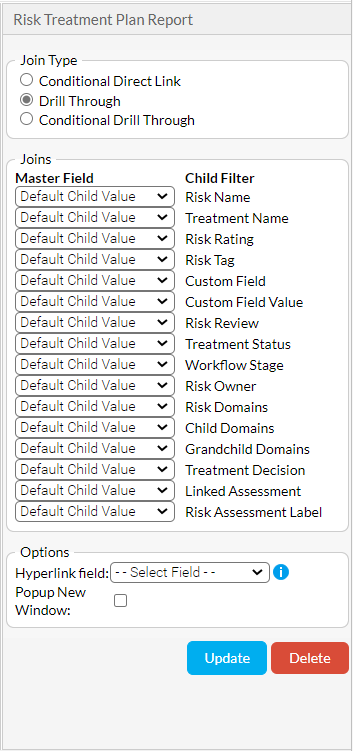
From here, you can determine how the fields from the current report (Master Fields) will link to the filters in the Drill-Through Report (Child Filters) using the Join Type.
- Conditional Direct Link - Join directly via the hyperlinked field and will only appear under certain conditions
- Drill Through - Drill-Through will be based on specific field and filter joins
- Conditional Drill Through - As above, but will only appear under certain conditions
All Child Filters need to be addressed for the Drill-Through to work. You can select 'Omit' if a field is not relevant for the Drill-Through.
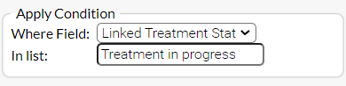
Conditional joins allow you to specify when the Drill-Through will be active. This is based on a reference field and a list of inputs.
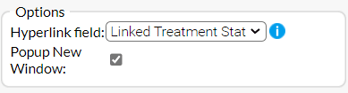
The Options section allows for the Drill-Through to be activated by a field within the current report table.
Click Update once completed to complete the join.
You can preview the results (including testing the join filters) via the Design tab.
Adding Drill-Through to Charts
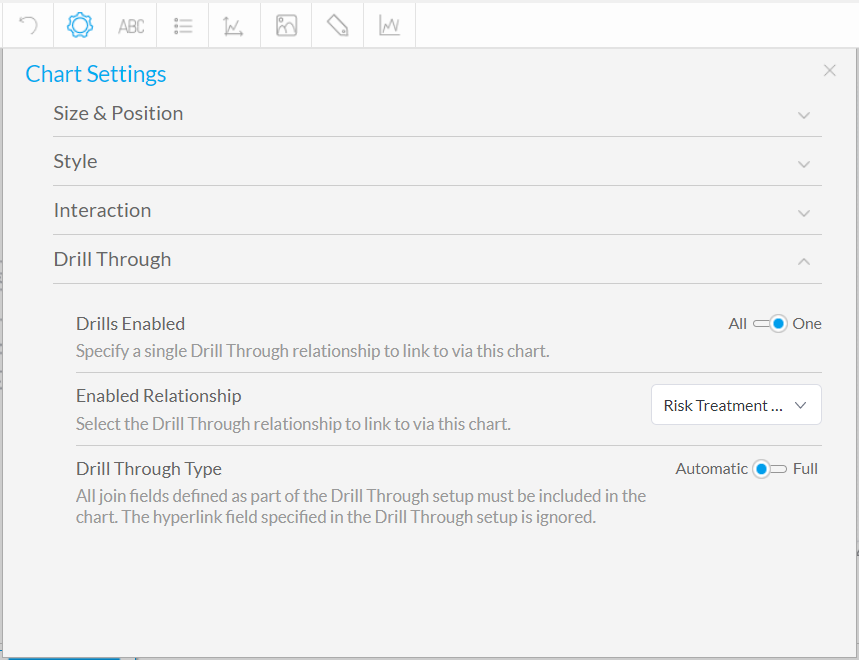
Drill-Through reports can alternatively be linked to Charts. This will enable these reports to appear when a user clicks on data within a Chart. Below is an example of this from a standard 6clicks report.
To do this, follow the previous steps and then go to the Chart Settings > Drill Through in the Chart editor.
Setting the above requires a chart to have been built within the report. For more information on creating and editing report charts, please refer to this article.