Navigate to the Analytics tab using the top right menu navigation. Click here for an overview of the Reporting & Analytics module.

Select the By Folder Dropdown > 6clicks Reports & Dashboards > Issues & Incidents. Select the Issue Register report.
Or
In the All Content search bar, enter your search term, e.g., Issue Summary, to find the report in question.
Select the By Folder Dropdown > 6clicks Reports & Dashboards > Issues & Incidents.
Select the Issue Summary report.

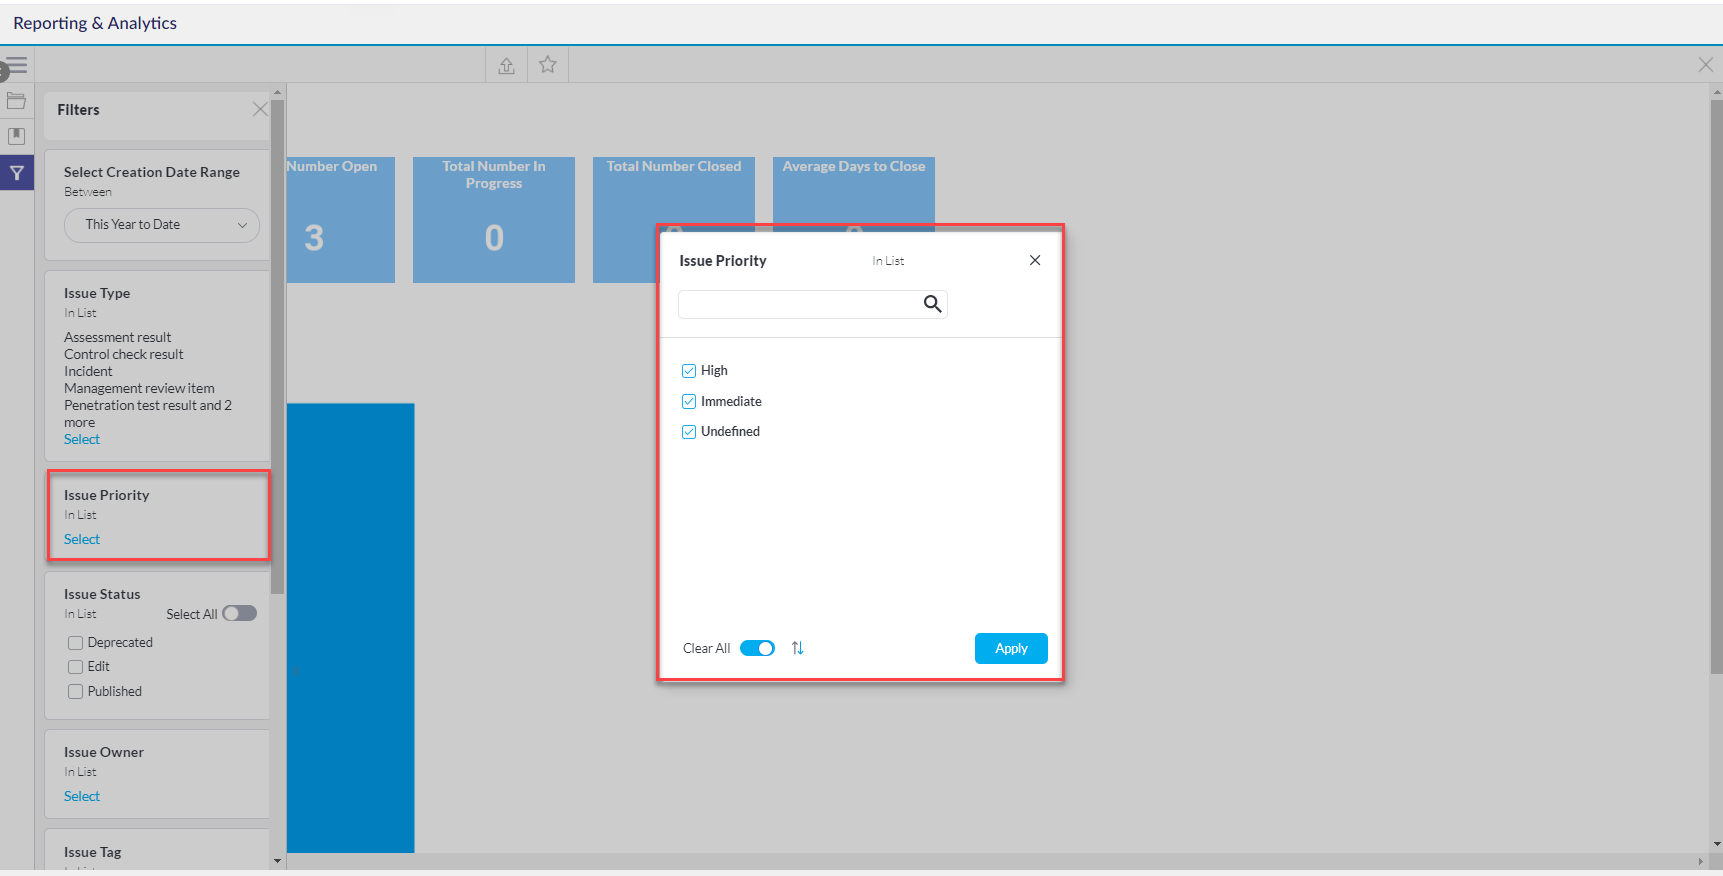
Select the filter icon in the left side panel.

The filter options will appear. Select the appropriate filters to view various issues and incidents and then apply your choices to generate a report.
- Select Creation Date Range: Select the creation date range from the dropdown list. The date or date range can also be typed into the boxes under the Date field if you choose to view a custom date and click on the calendar icon.

- Issue Name: Select the issue name from the list. Slide the Select All toggle to select all options available. Click Apply to apply selection.
- Issue Type: Select the issue type from the list. Slide the Select All toggle to select all options available. Click Apply to apply selection.
- Issue Priority: Select the issue priority level from the list. Slide the Select All toggle to select all options available. Click Apply to apply selection.
- Issue Owner: Select the issue owner's name from the list. Slide the Select All toggle to select all options available. Click Apply to apply selection.
- Issue Tag: Select the issue tag from the list. Slide the Select All toggle to select all options available. Click Apply to apply selection.
- Custom Field: Select the custom field from the list. Values shown here are associated with any custom fields you have created in your issue register. Slide the Select All toggle to select all options available. Click Apply to apply selection.
- Custom Value: Select the custom value from the list. Values shown here are associated with any custom fields you have created in your issue register. Slide the Select All toggle to select all options available. Click Apply to apply selection.
- Assigned Team: - Select the assigned team from the list. Slide the Select All toggle to select all options available. Click Apply to apply selection.
- Assessment: Select the assessment name from the list. Slide the Select All toggle to select all options available. Click Apply to apply selection.

After all filter selections have been chosen, click the Apply button at the top or bottom of the list of filters. Click Reset if you wish to remove all filter selections and start the filter selection process from the start.

The assessment report results will populate. The results will appear in a bar chart, displaying the number of issues on the Y-axis and the creation and the closed date on the X-axis.

Click here for more information on Issues and Incidents.