
Overview
Insights is a tab on your Controls register that turns information you have already captured — your controls, the tests against them, the evidence collected and the frameworks you are working to — into a single picture of how your control environment is performing. It tells you how much of your register is being tested, how those tests are going, which controls need attention, and how well your frameworks are covered. Each individual control also has its own Insights tab, giving you the same kind of picture for just that control.
You do not enter anything new to use Insights. It reads what is already there.
Scenario
Prerequisites
Insights uses information from your existing registers, so the more complete your register data is, the more useful your insights will be.
For Insights to provide meaningful results, make sure you have:
- Controls in your Controls register that are active.
- Tests in your Test register that are linked to those controls and are themselves active.
- Test logs that have a recorded result — a pass, a fail or a partial.
- Evidence uploaded against those test logs.
- Controls linked to the framework requirements they satisfy.
- Risks linked to your controls.
- The Domain and Type fields filled in on your controls.
What Insights counts, and what it ignores
Insights deliberately reports on your live control environment rather than everything that has ever existed in the register. Three rules decide what is counted:
- Controls are counted only when they are at the Active stage and have not been archived. A control still in draft, paused, or archived does not appear anywhere on the page.
- Tests are counted only when they are at the Active stage. A draft or paused test does not contribute to coverage or pass rate, even if it is linked to an active control.
- Superseded test logs are ignored. When a test log has been replaced, it no longer counts towards the pass rate, and it is not treated as the test's latest result.
Note: The totals shown in Insights may differ from those in your register because Insights includes only active, non-archived controls and active tests. If a control is missing from Insights, check its stage and archive status.
How the information flows
The page is built from a chain of links you create as you work. Each step adds another part of the picture.
- You create a control and link it to the framework requirements it satisfies.
This is what allows Insights to report framework coverage. - You link one or more tests to that control.
A control with no linked test counts as untested, however well written it is. - Each test produces test logs on its schedule, and someone records the result of each one.
This is what drives the pass rate. - Evidence is uploaded against those test logs and validated.
This is what drives the evidence measures and the confidence rating. - You link risks to your controls and fill in the Domain and Type fields.
This is what drives the risk and breakdown views.
Everything on the Insights page is read from these links at the moment you open it, so it always reflects the current state of your registers.
Controls overview
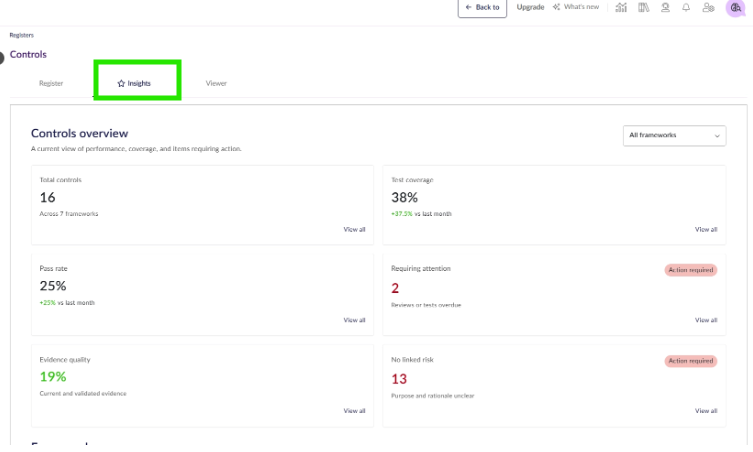
The first section gives you six headline numbers for the whole register.
- Total controls — how many active controls you have, and how many frameworks they span between them.
- Test coverage — the share of your controls that have at least one active test linked to them.
- Pass rate — the share of your tests whose most recent result was a pass. Each test counts once here, however many times it has been run.
- Requiring attention — how many controls need action, either because a test is past its due date with no result recorded, or because the evidence on the control's most recent test has gone stale. A control with both problems is still counted once.
- Evidence quality — the share of your tested controls that have evidence attached to their most recent test.
- No linked risk — how many controls are not linked to any risk, which usually means the reason the control exists has not been captured.
Two of these cards carry an Action required marker when the number is above zero, so the things that need attention stand out without you having to read every figure.
Note: The captions beneath two of the figures do not describe everything included in the calculation. The following explains what each figure measures:
- Requiring attention is captioned "Reviews or tests overdue", but the number also includes controls whose evidence has gone stale. The Top controls requiring attention table further down shows you which reason applies to each control.
- Evidence quality is captioned "Current and validated evidence". The figure reflects whether evidence has been collected against the most recent test — it does not tell you whether that evidence passed validation. For that, look at the Evidence confidence and Requirement status cards on an individual control.
Focusing on a single framework
Above the cards there is a framework selector, set to All frameworks by default. Choosing a single framework narrows the six cards to just the controls that satisfy that framework's requirements, which is useful when you are preparing for one specific audit. The rest of the page stays as it is.
Opening the list behind a number
Each card has a View all link. Selecting it takes you to your Controls register showing exactly the controls that card counted, so you can move straight from a number to the records behind it and start working on them. If you have a framework selected, that selection is carried across too.
Note: The View all link appears only when a card’s value is greater than zero. If the value is zero, there are no results to display, so the link does not appear.
Framework coverage
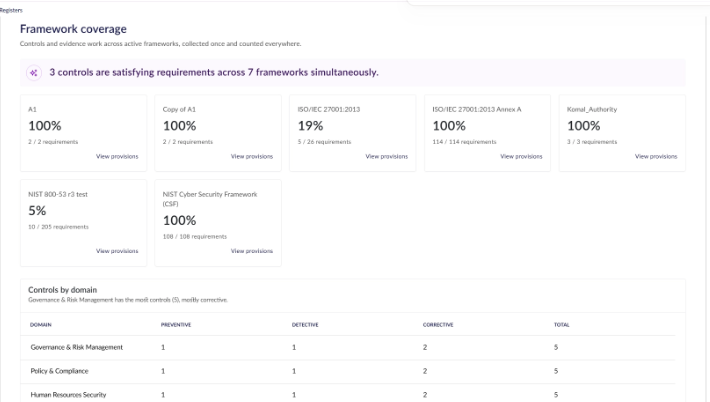
The second section shows how your controls map to the frameworks you are working to.
- A banner tells you how many of your controls are satisfying requirements across several frameworks at once — the work you have done once that is counting in more than one place.
- Below it, there is a card for each framework, showing how much of that framework your controls cover and how many of its requirements you have addressed.
- Each card links through to the framework itself, so you can see which requirements are still open.
Controls by domain
This table breaks your controls down by the domain they belong to, with a column for each control type you use. It answers where your controls are concentrated, and whether you are relying mostly on preventive, detective or corrective controls in a given area.
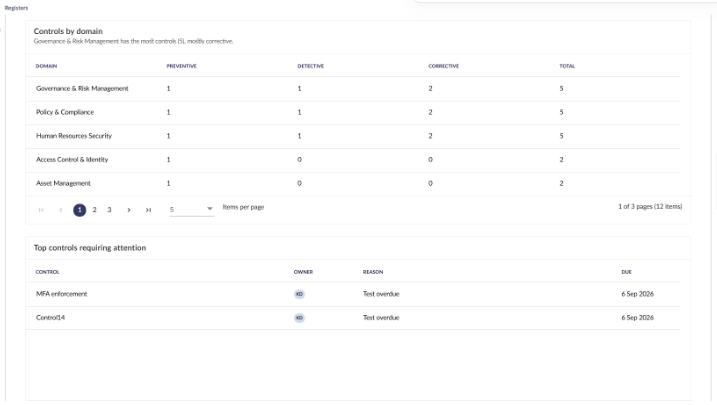
Note: A control can belong to multiple domains and is counted once in each. As a result, the column totals may be higher than the total number of controls. This is expected.
Top controls requiring attention
This table lists the controls that need action, with the owner, the reason and the due date. It is the detail behind the Requiring attention card above, built from the same two reasons, so the count on the card and the number of rows here always agree:
- A test on the control is past its due date with no result recorded.
- The evidence on the control's most recent test has gone stale.
The most overdue controls appear at the top of the table, helping you identify where to start. If a control requires attention for more than one reason, it appears once with all applicable reasons listed.
Insights for a single control
Every control also has its own Insights tab, which answers the same questions for that one control.
- Effectiveness rating — the current health of the control, as rated by your team.
- Pass rate — the share of this control's test runs that passed, counted across every run its tests have ever produced. This asks a different question from the pass rate on the register page, which counts each test once using only its most recent result, so the two figures will not always match. A test that has run ten times and passed nine shows as a high pass rate here, while on the register page it simply counts once as currently passing.
- Evidence confidence — how much confidence the evidence validation has in the evidence collected, shown as High, Medium or Low.
- Requirement status — whether the evidence requirements on this control's tests have been met, partially met or not met.
Below the cards, a framework section tells you how many frameworks this one control satisfies, with a card for each showing how many of its requirements the control addresses.
As on the register page, the pass rate and evidence cards have a View all link. Pass rate opens the tests behind the number, and the two evidence cards open the evidence files collected for this control, so you can go straight to the underlying records.
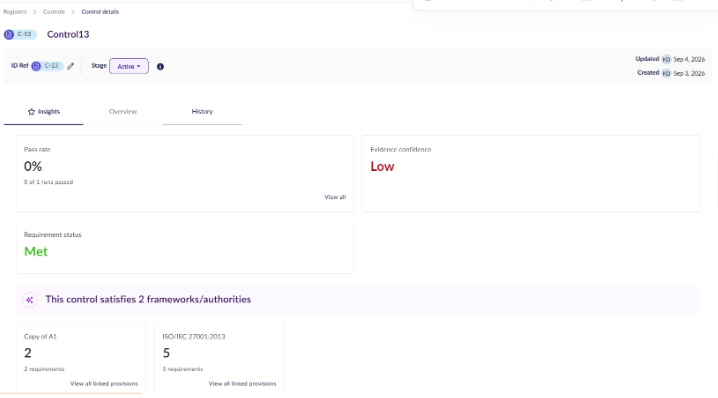
Note: The Effectiveness rating card only appears if your organisation has set up an Effectiveness field on the Controls register. If you do not use that field, the card is simply not shown rather than sitting there empty.
Comparing against last month
Test coverage and pass rate each show a comparison against the same point last month, so you can see whether things are improving or slipping rather than only where they stand today.
This works from a monthly snapshot:
- At the end of every month, the platform automatically records your headline numbers as they stood at that moment.
- When you open Insights, today's live figure is compared against the figure stored for the previous month.
- The difference is what you see on the card as the change since last month.
You do not need to do anything to make this happen, and you cannot lose a month by not opening the page — the snapshot is taken whether anyone is looking or not.
Note: Until a previous month's snapshot exists, there is nothing to compare against, and the cards show a change of 0%. In your first month of use, this reads the same as "no change since last month", so treat the comparison as meaningful only from your second month onwards. The same applies to a framework you have only just started using.