Livedocs and Stories
Instructions on how to create a Story using Livedocs
Click on Analytics (1)>Then the Create (2) button and hit Story (3).

Once you click Story (3) the following screen pops-up. Hit Get Started.
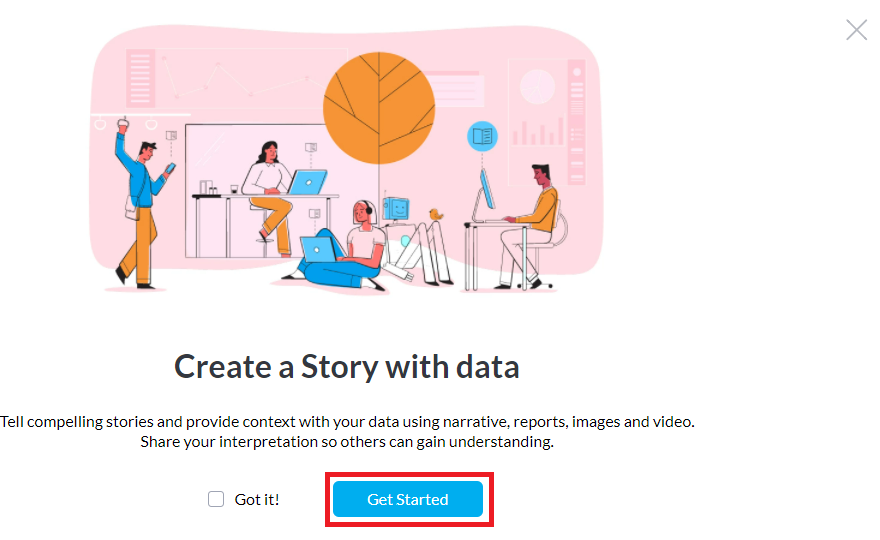
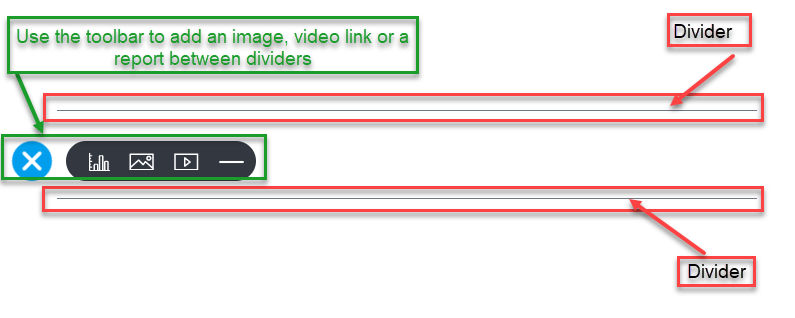
Once you hit Get Started, you can start creating your Story which looks like a Word document, where you can give your story a title, Add a Report, Add an image, Add a video and Add a divider.
1- Please enter the title of your Story, which is saved automatically.

Once you have given your Story a title it will look like this: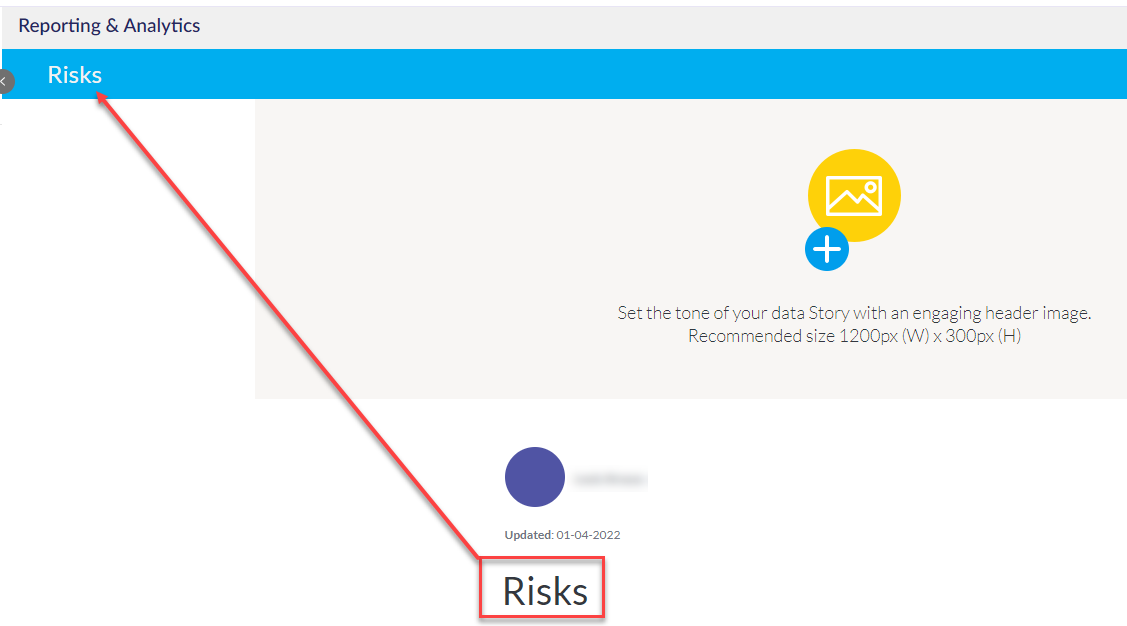
2- Click on the plus sign + to upload a head image for your story.

To Add Content to your Story click on the plus sign + below the name of your story.

you will then have a range of options to select from depends on what you would like to add to your story.

2- Add an image
3- Add a video
4- Add a divider
To add a report click on Add report button  then search for the report you would like to add to your Story i.e Risk Matrix. Select the report you are looking for and click on Insert into Story.
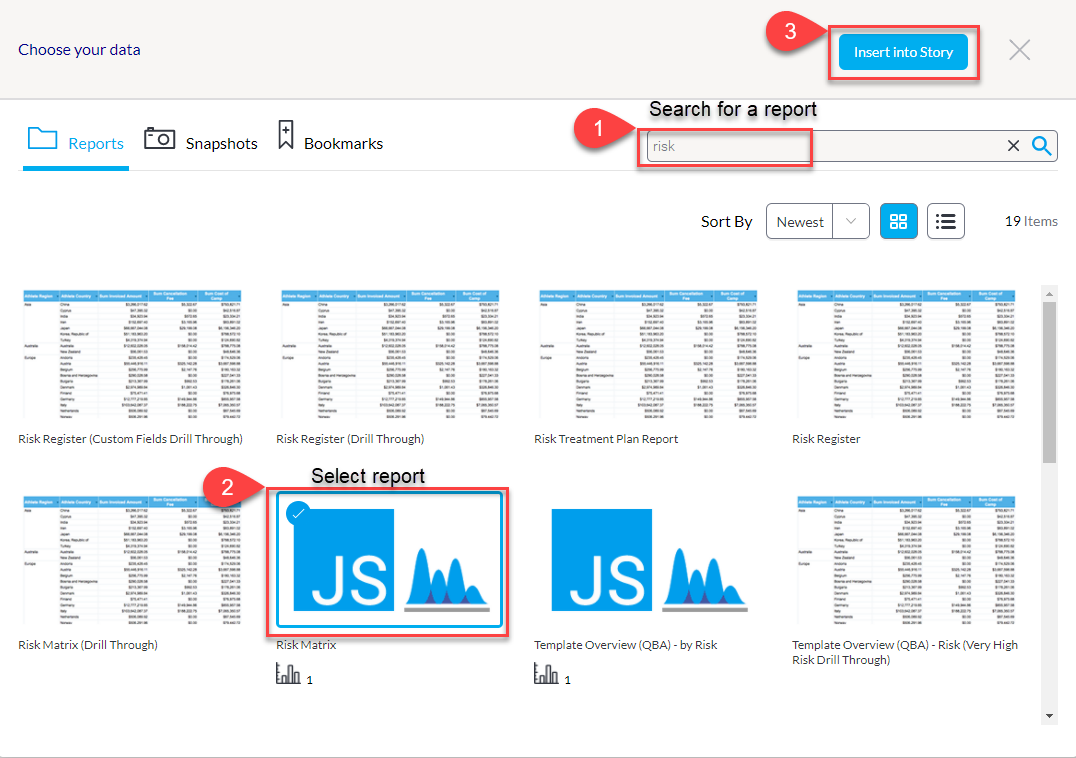
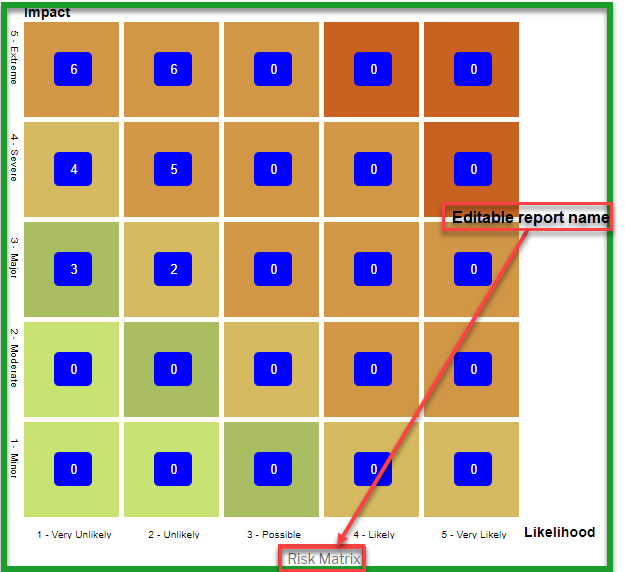
The report you have selected will appear in your Story.
Hint: You can add multiple reports at once, just select the ones you would like and click Insert into Story, also, the name of the report can be edited.
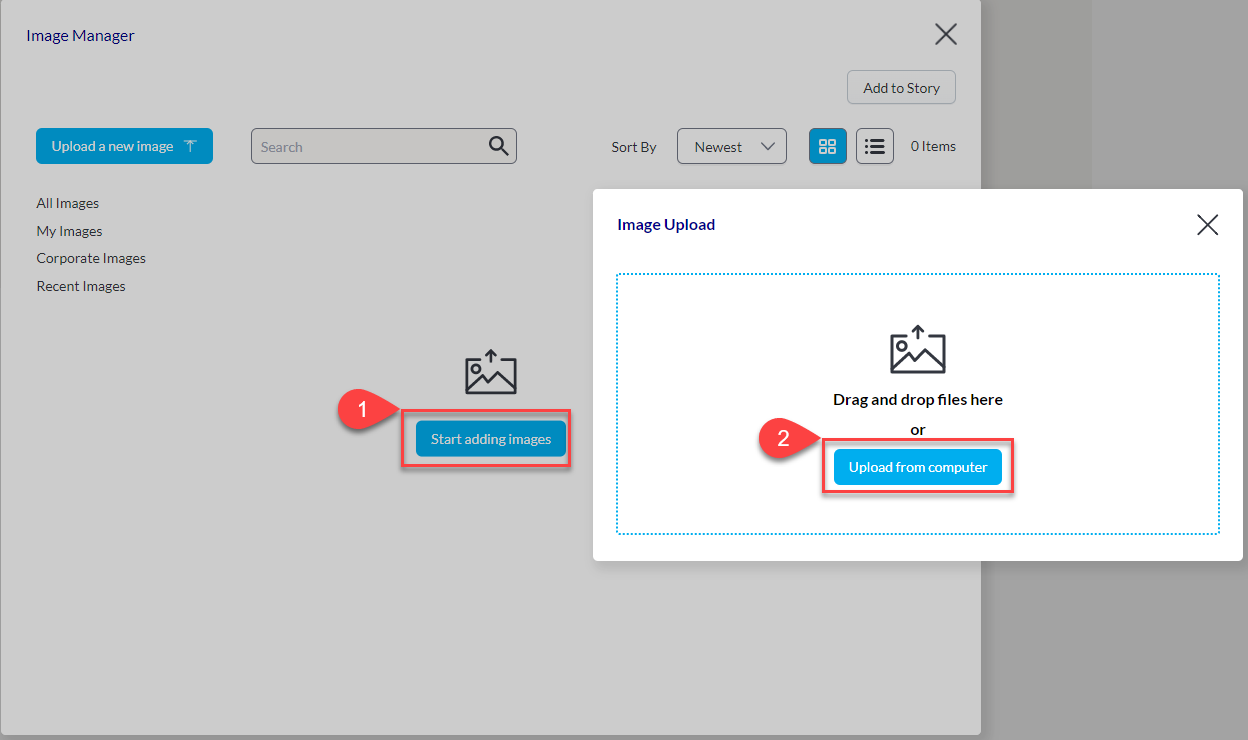
To Add an image click on Add image button  . Click Start adding Images then you can drag and drop the image or hit Upload from computer and select the image you want to upload.
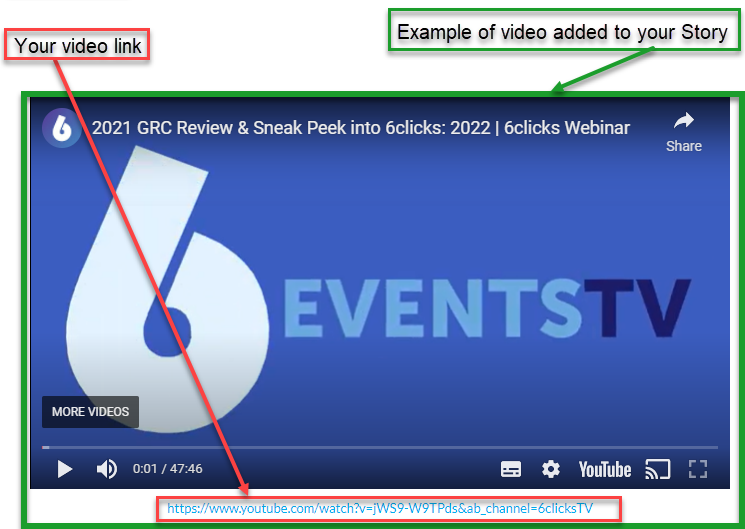
To add a video click on Add a video button  then enter or copy+paste a Youtube or Vimeo video link in the box and hit Enter.
To add a divider click on Add a divider button  then a divider will appear on top.
As you are creating your Story you then have the options to, Preview, Browse Stories or Delete Version.

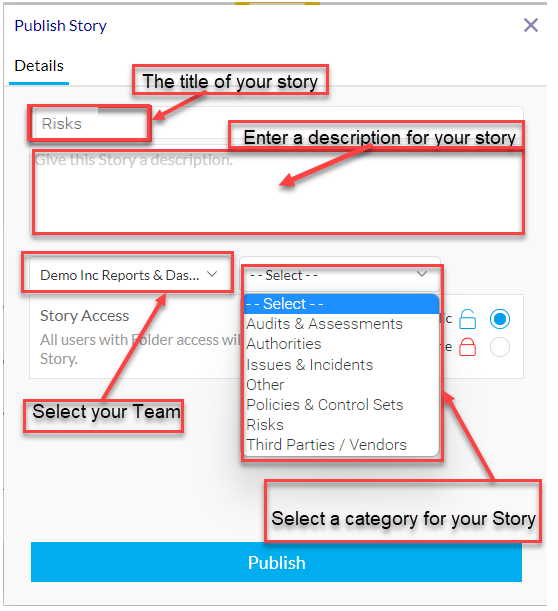
Once you have finished with your Story you can do the final touches from the Publish Story window and click on Publish to publish your Story.
One you are happy with your Story and have clicked on Publish you then get an overview of your Story with all the details such as the Title of your Story, the person who published it and the date it was published and much more under the More option

Creating stories in Dashboard is very simple and straightforward; it gives you the ability to provide context to your data using narrative, reports, images and videos.