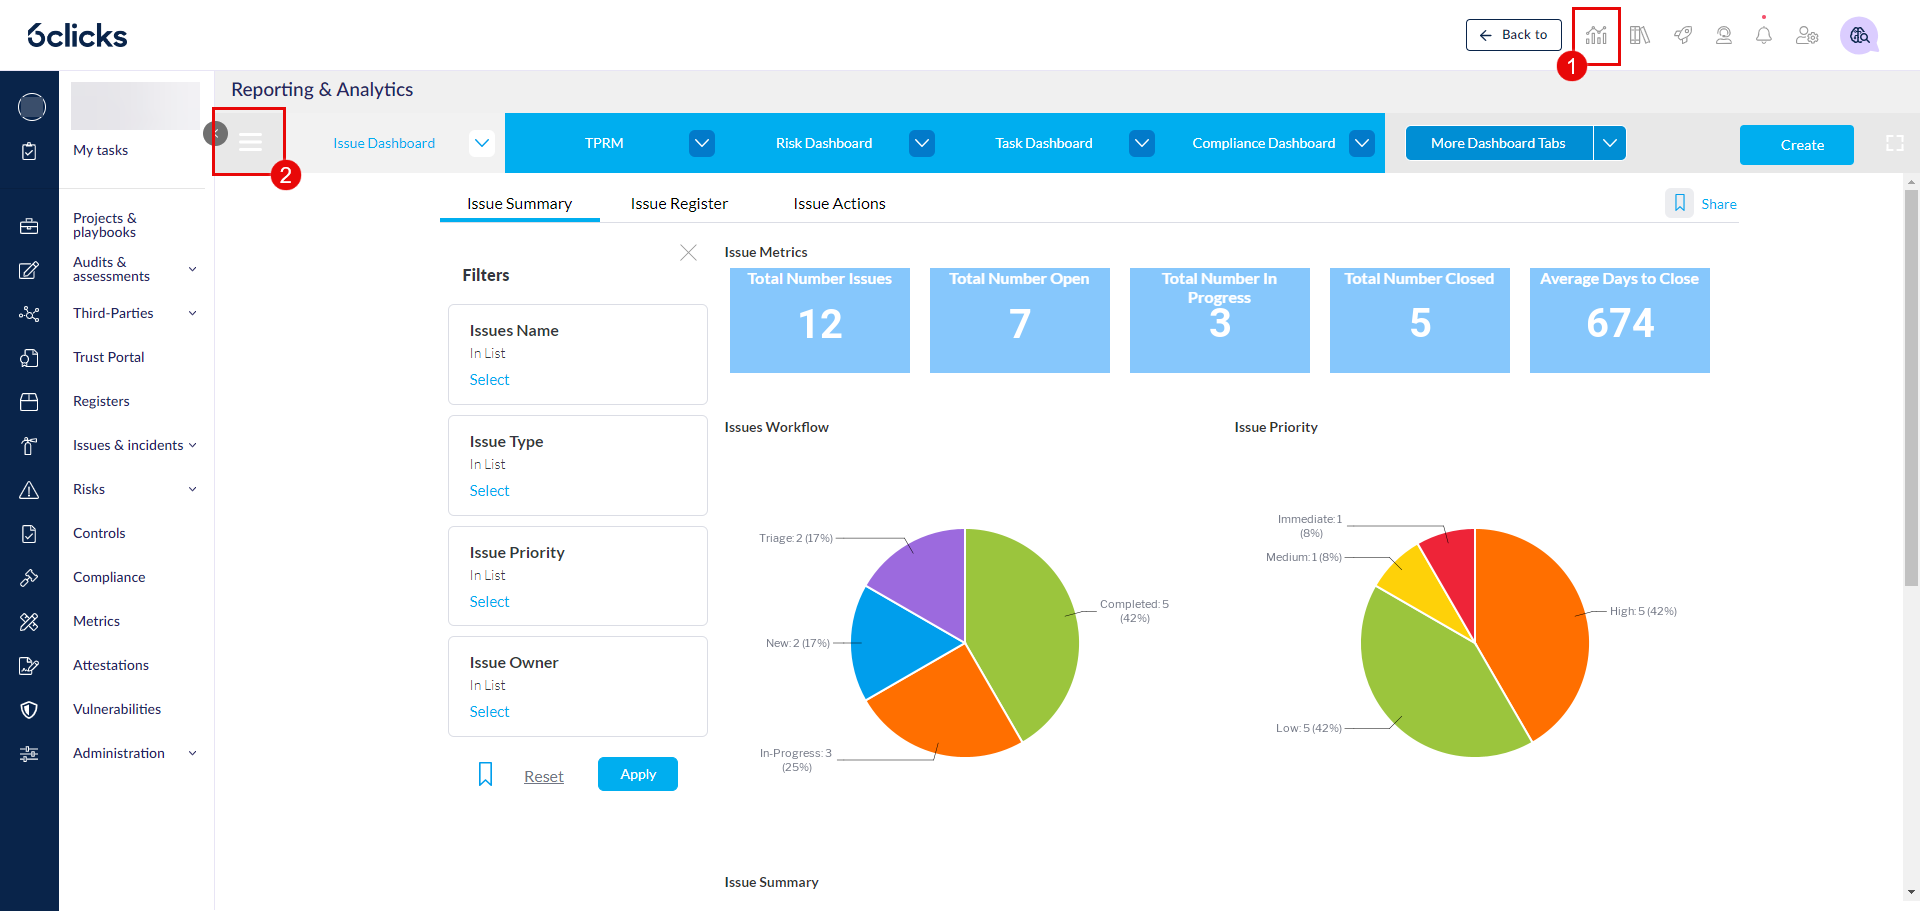
Navigate to Analytics (1) and click on the menu (2).
Your landing view in the Analytics module is dependent on your permissions & setup.
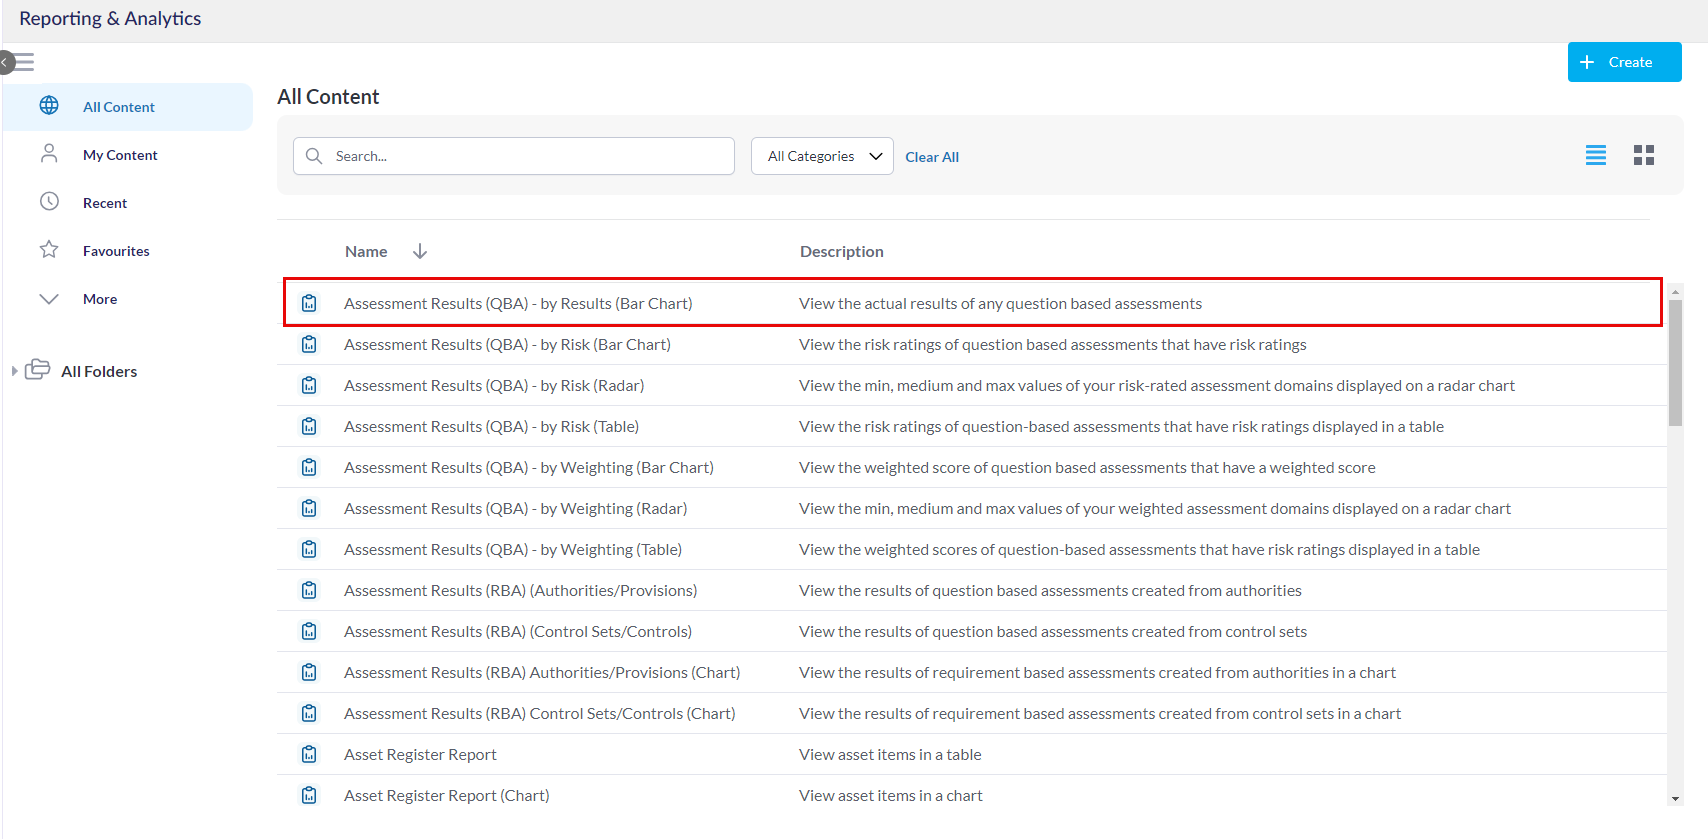
Click Browse and select the Assessment Results (QBA) - by Results (Bar Chart) report.
Select the filter.
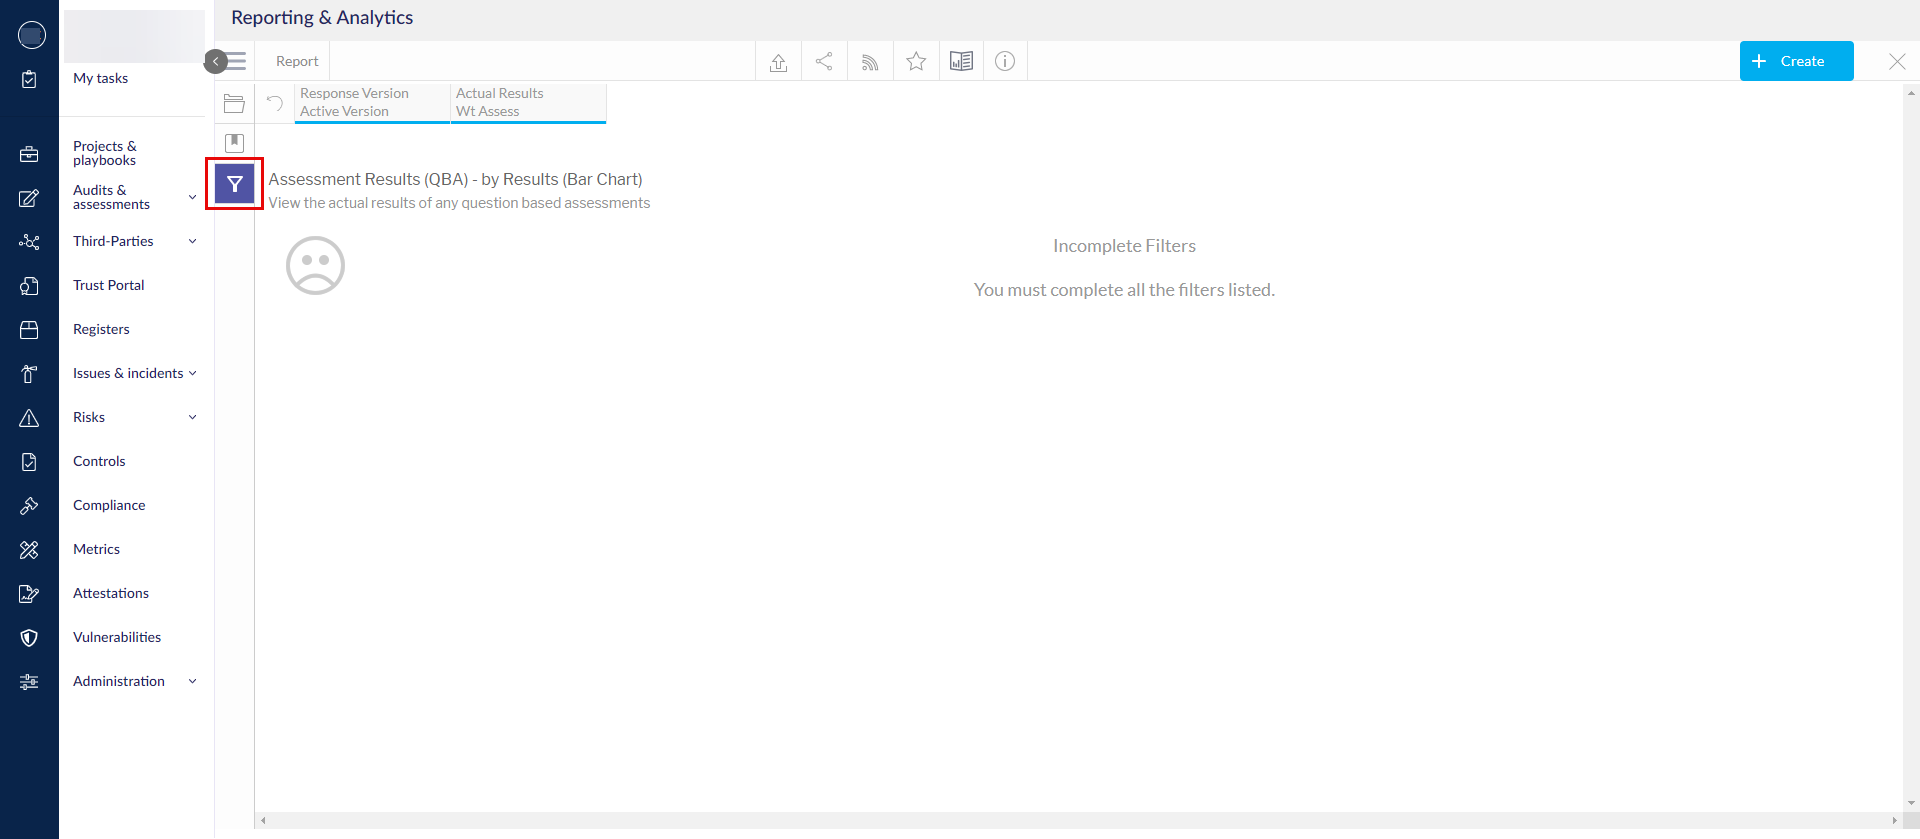
Select the appropriate filters to view various QBA assessments and generate a report. Not all filters options are mandatory. Mandatory filters options will be indicated by a red dot.
You can only use this report to report on Completed assessments. For assessments that are still in progress, use one of the reports starting with Progress Report.
- Template - Selecting the Template filter will show all available QBA templates from which the assessment was created. Slide the Select All toggle to select all options available. Click Apply to apply selection.
- Responding Team - Select the responding team. Slide the Select All toggle to select all options available. Click Apply to apply selection.
- Assessment - Select the assessment which will display the data. Slide the Select All toggle to select all options available. Click Apply to apply selection.
- Response Version - Select the response version of the assessment. Slide the Select All toggle to select all options available. Click Apply to apply selection.
- Domain - Select the domain from the assessment which was chosen. Slide the Select All toggle to select all options available. Click Apply to apply selection.
- Question Tags - Select the question tags. Slide the Select All toggle to select all options available. Click Apply to apply selection.
After all filter selections have been chosen, click Apply. Click Reset to remove all filter selections.
The assessment report results will populate. The results will appear in a bar chart, displaying the domain names on the Y-axis and the number of responses on the X-axis.
Hovering over each bar in the bar chart shows an overview of the information the bar is representing. Click on a bar to show more details in a table. Click on the square in the top right of the table to make it full screen.