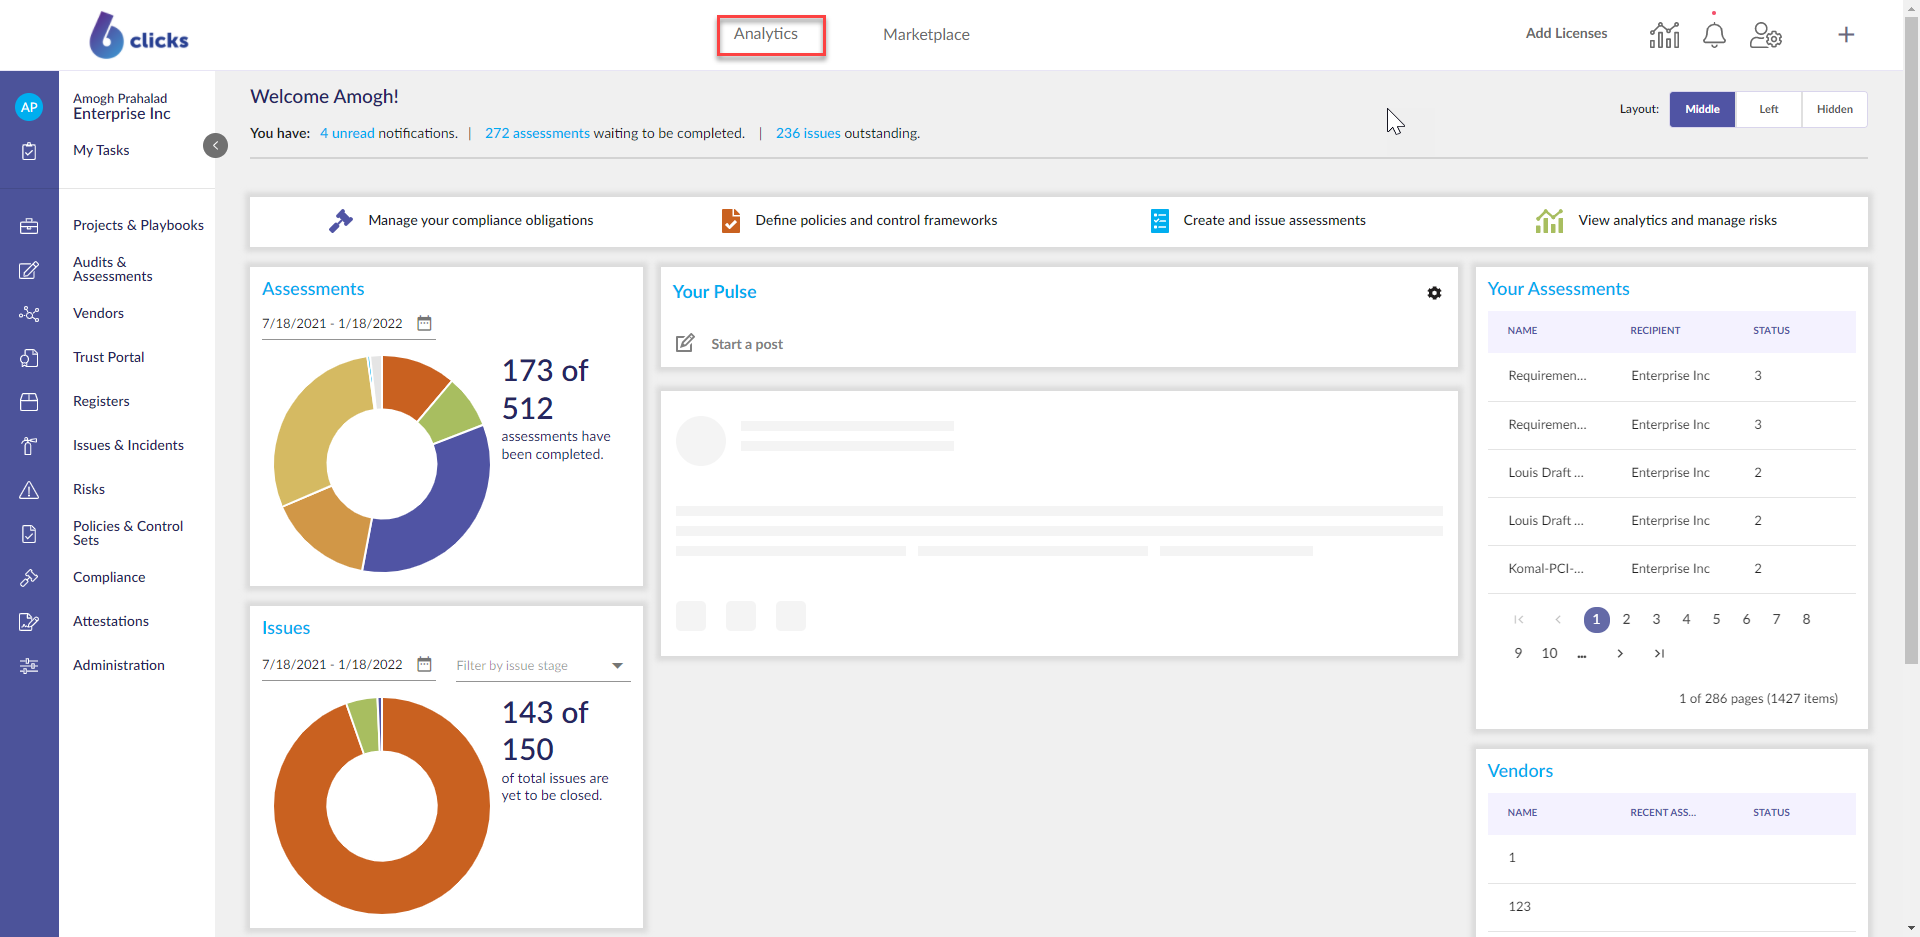
Navigate to the Analytics tab using the top menu navigation.
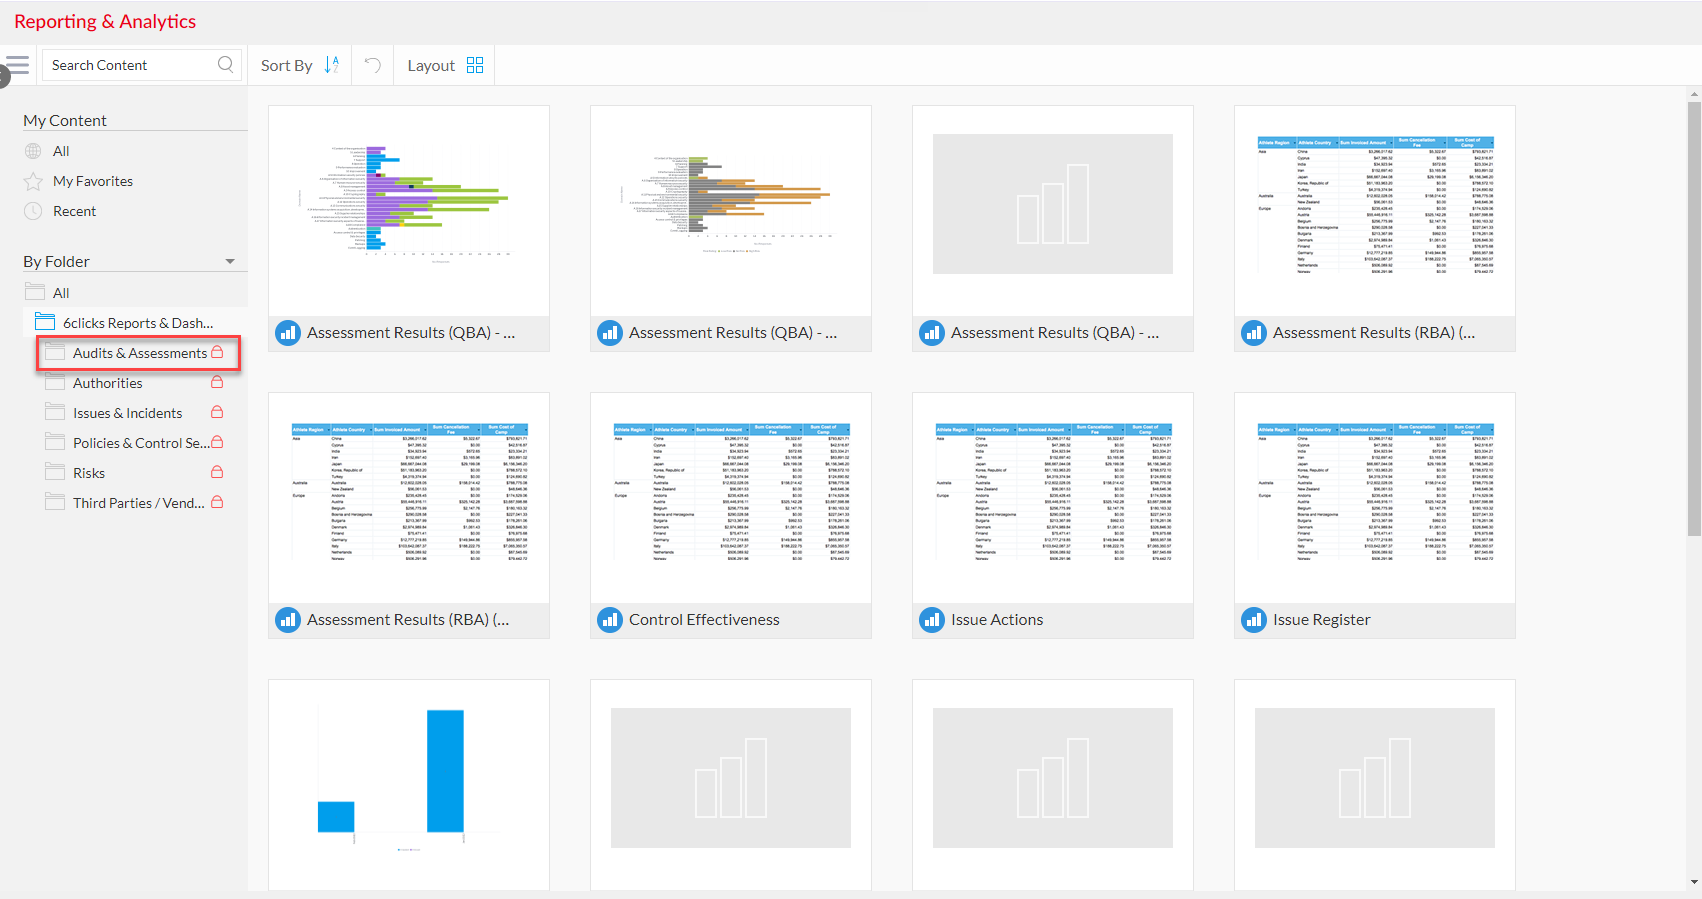
Select the By Folder Dropdown > 6clicks Reports & Dashboards > Audits & Assessments.
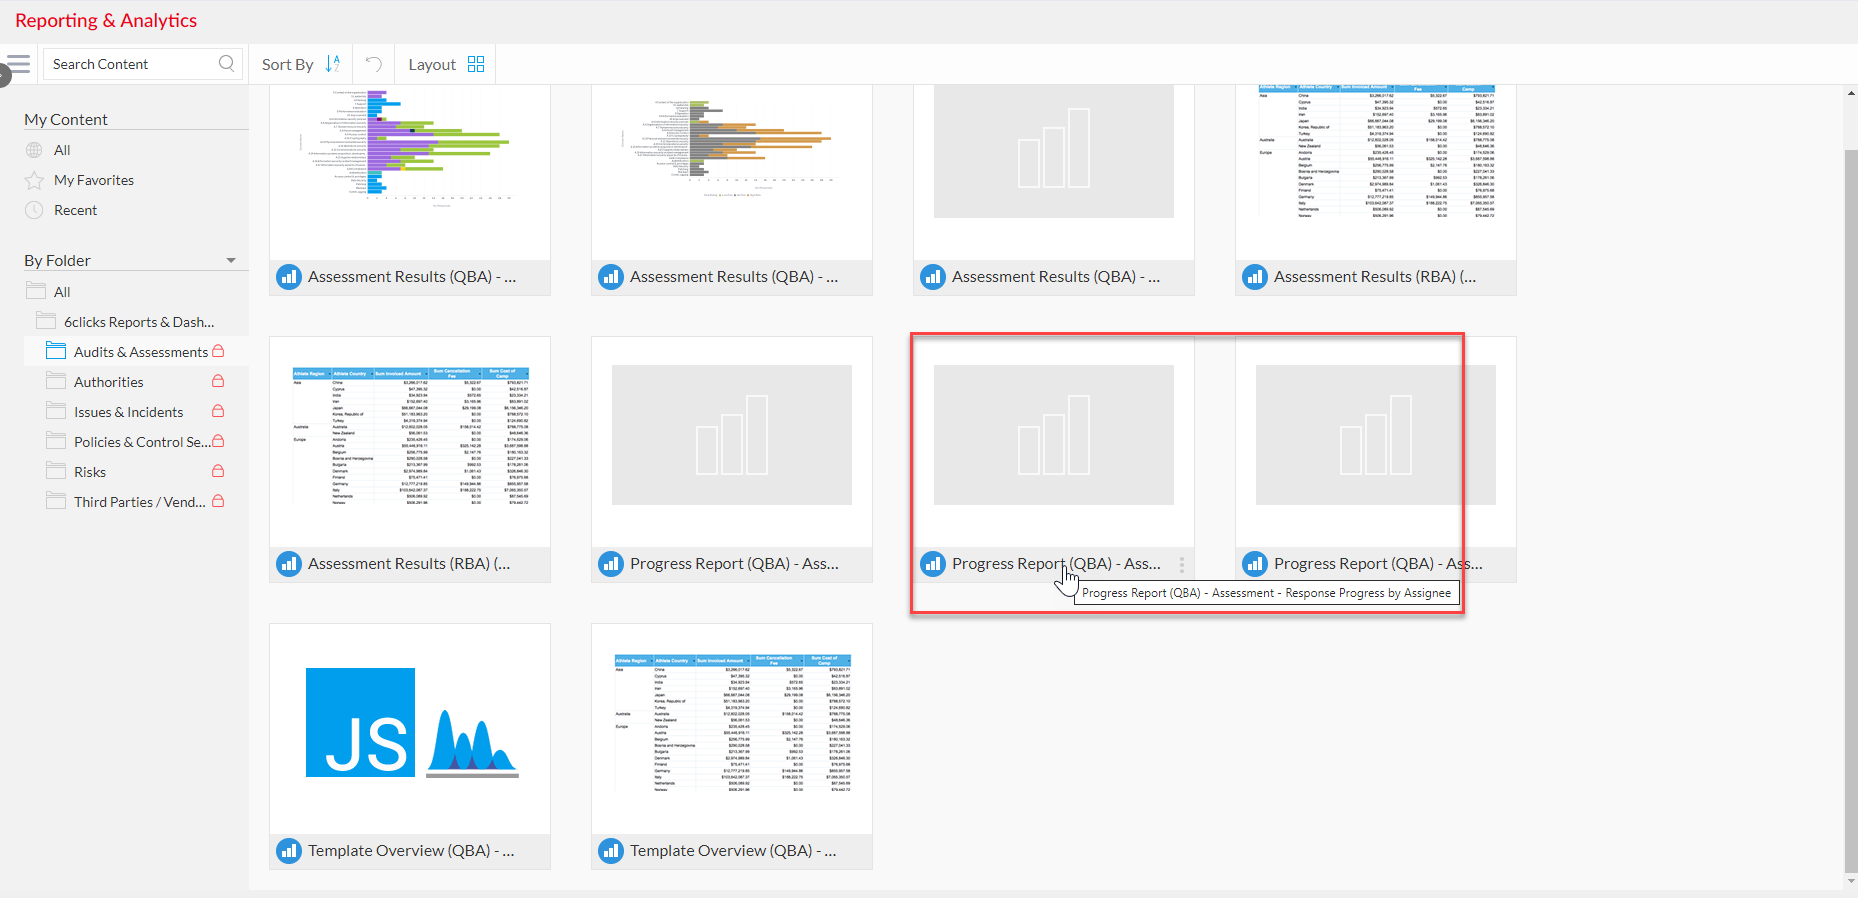
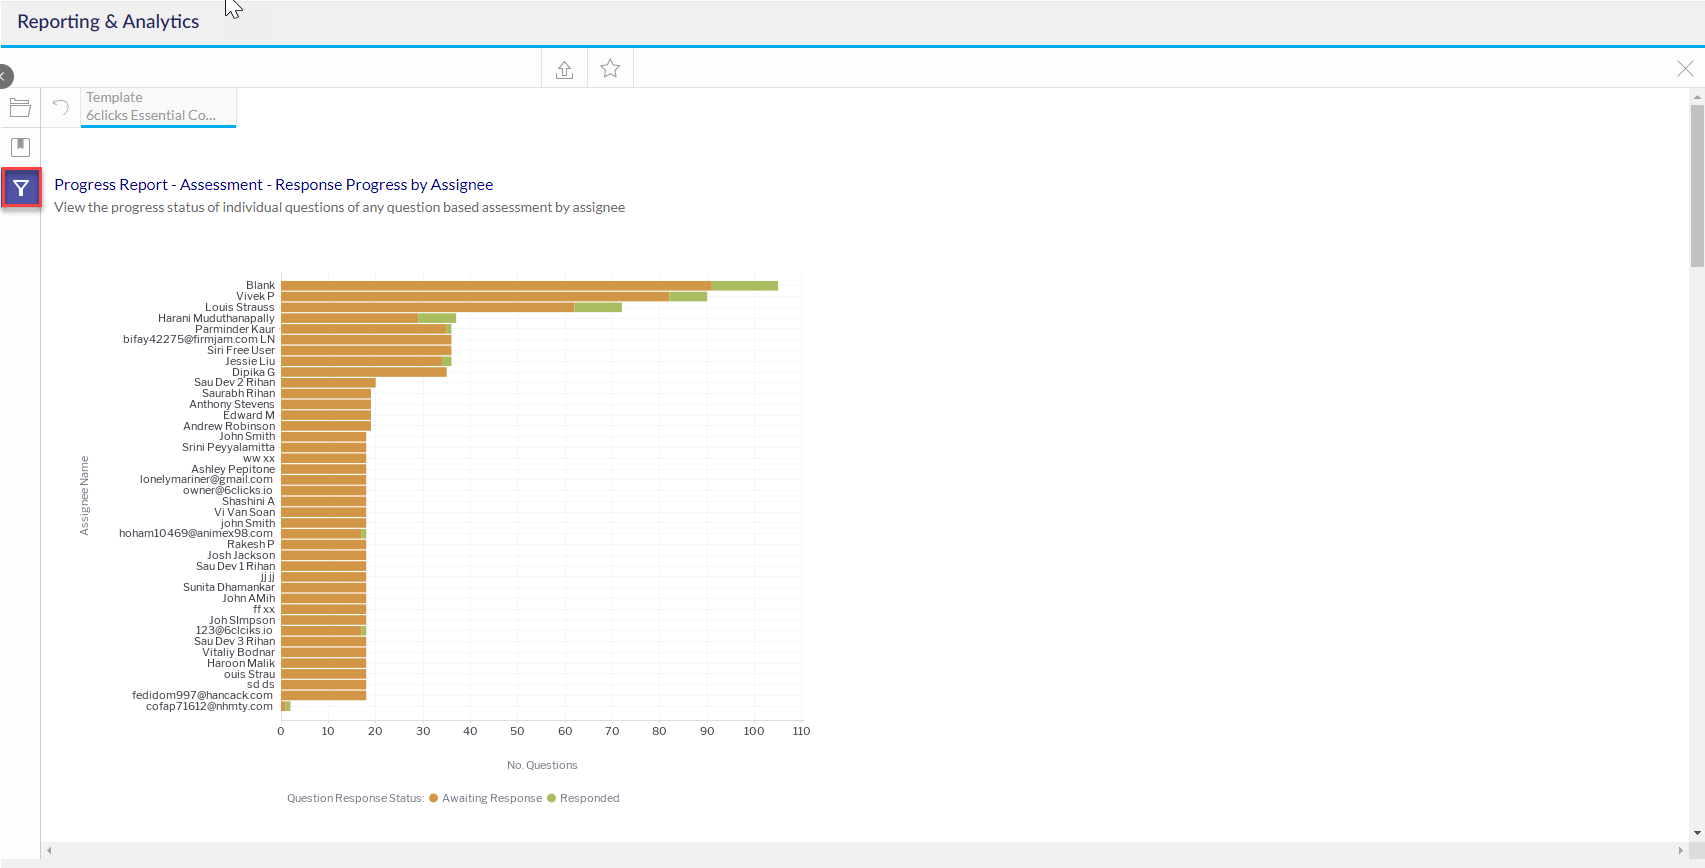
Select the Progress Report - RBA Assessment - Response Progress by Assignee report.
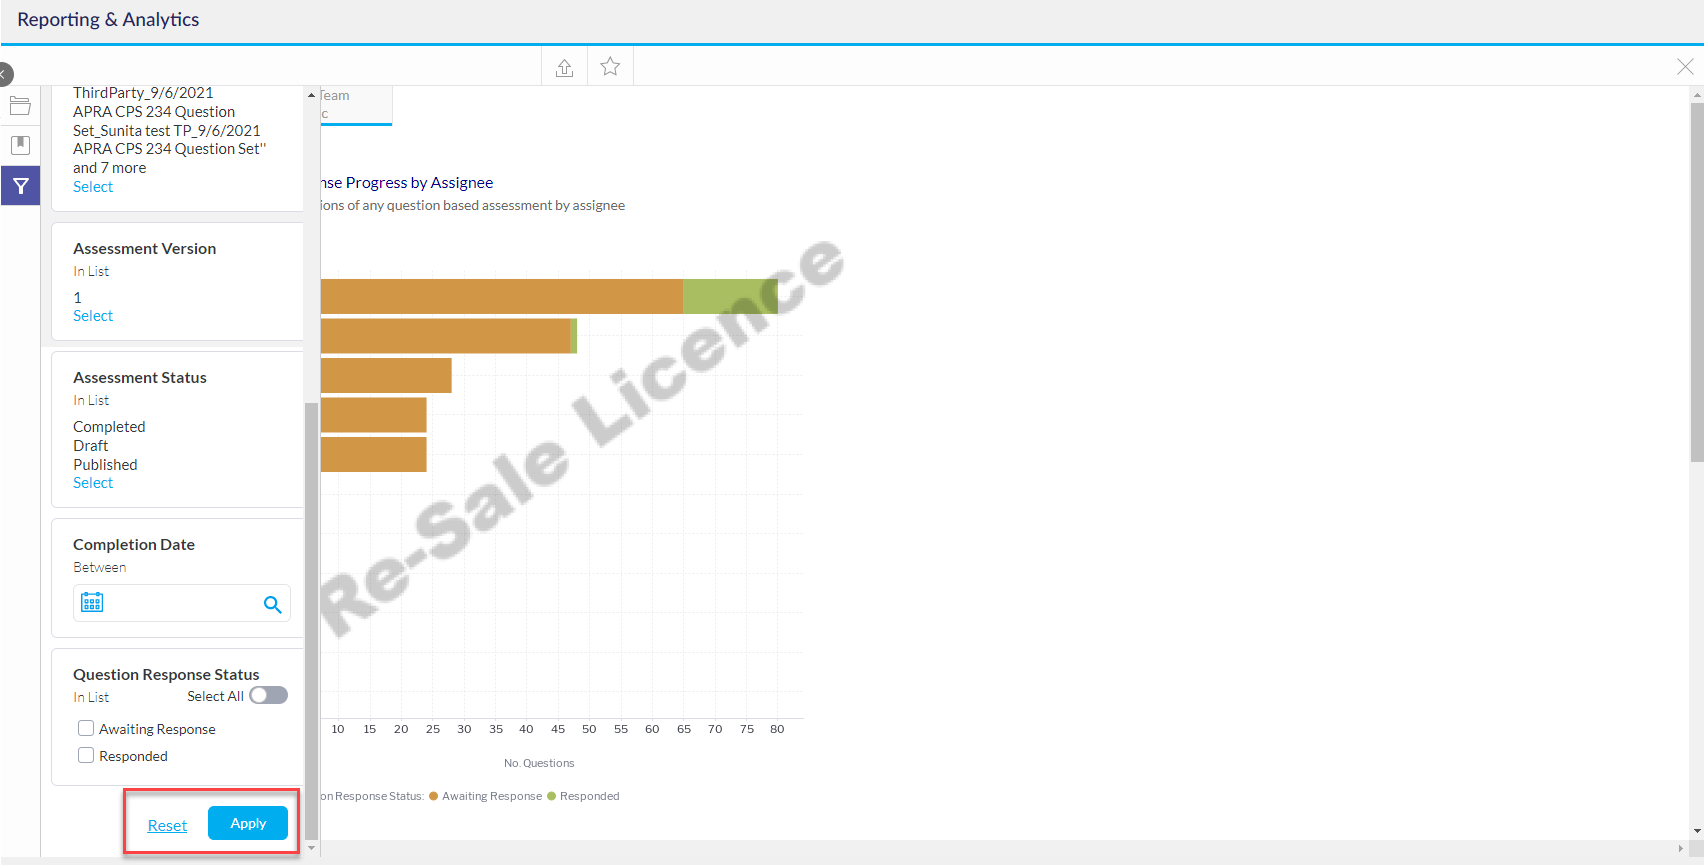
Select the filter icon in the left side panel.
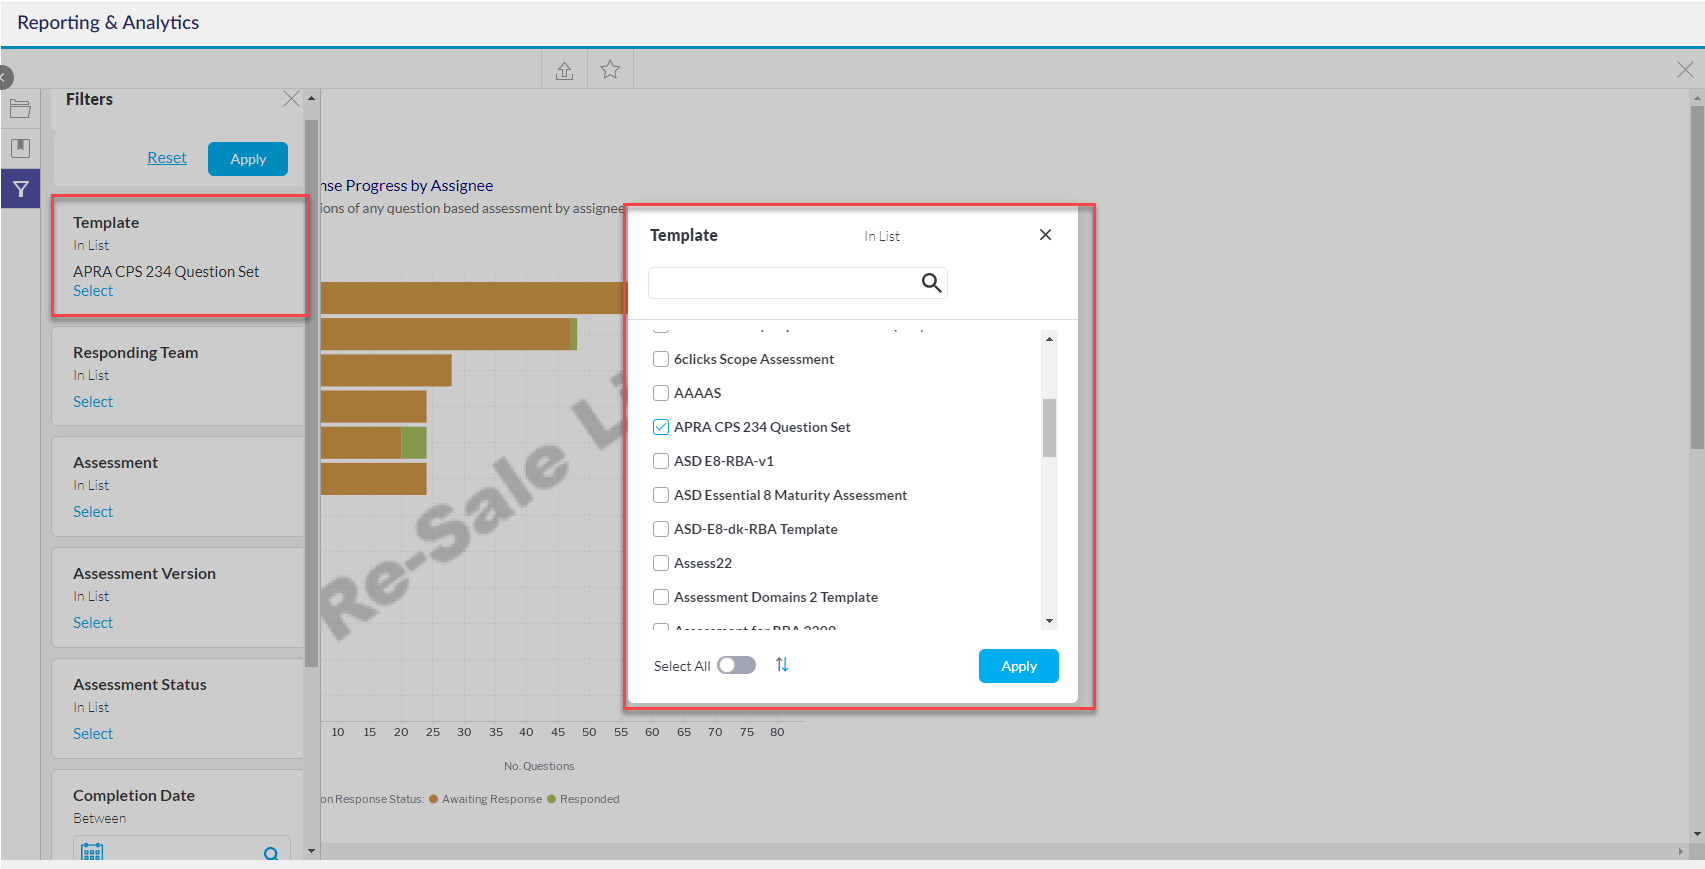
The filter options will appear. Select the appropriate filters to view various RBA assessments and generate a report. Not all filters options are mandatory. Mandatory filter options will be indicated by a red dot.
- Template - Selecting the Template filter will show all available RBA templates from which the assessment was created. Check the Audit and Assessments module to ensure you are selecting an RBA from the templates list. Slide the Select All toggle to select all options available. Click Apply to apply selection.
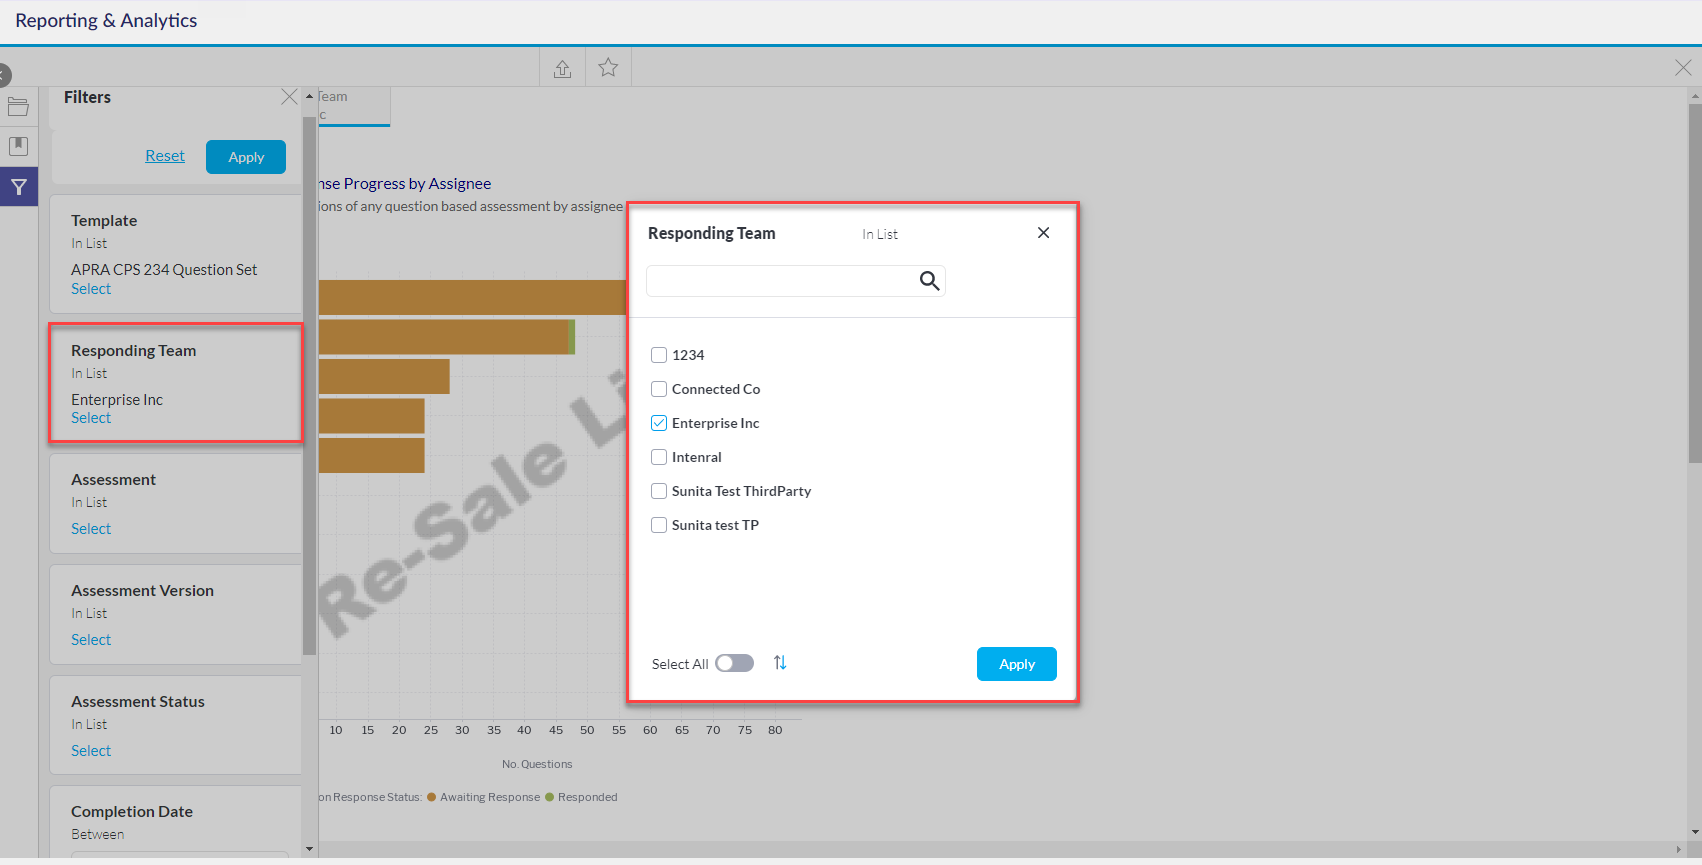
- Responding Team - Select the responding team. Slide the Select All toggle to select all options available. Click Apply to apply selection.
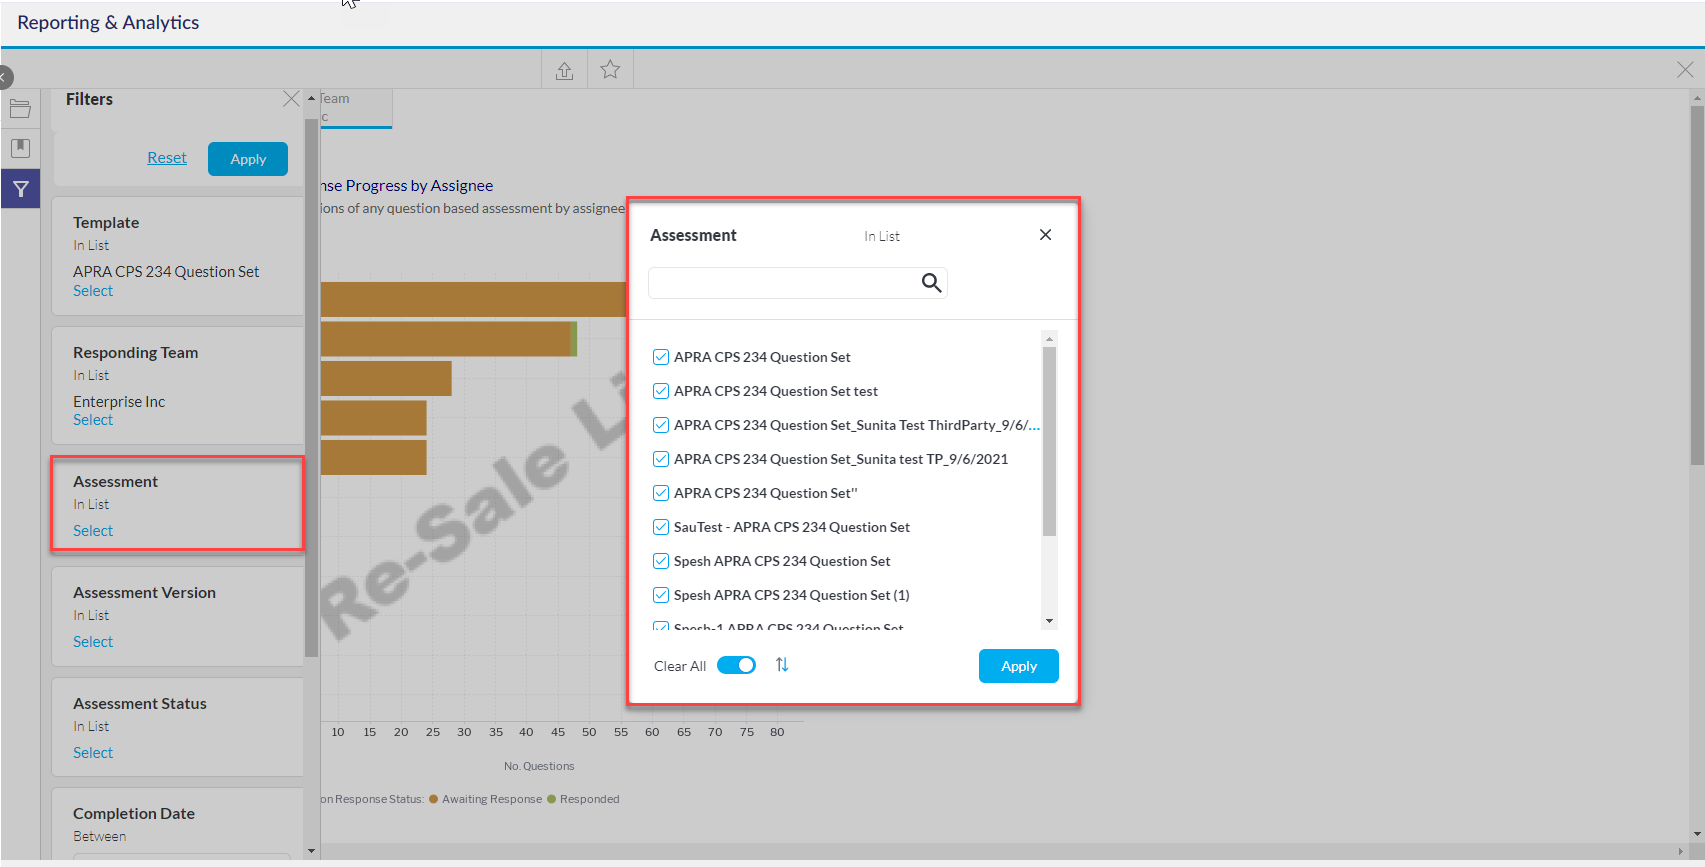
- Assessment - Select the assessment which will display the data. Slide the Select All toggle to select all options available. Click Apply to apply selection.
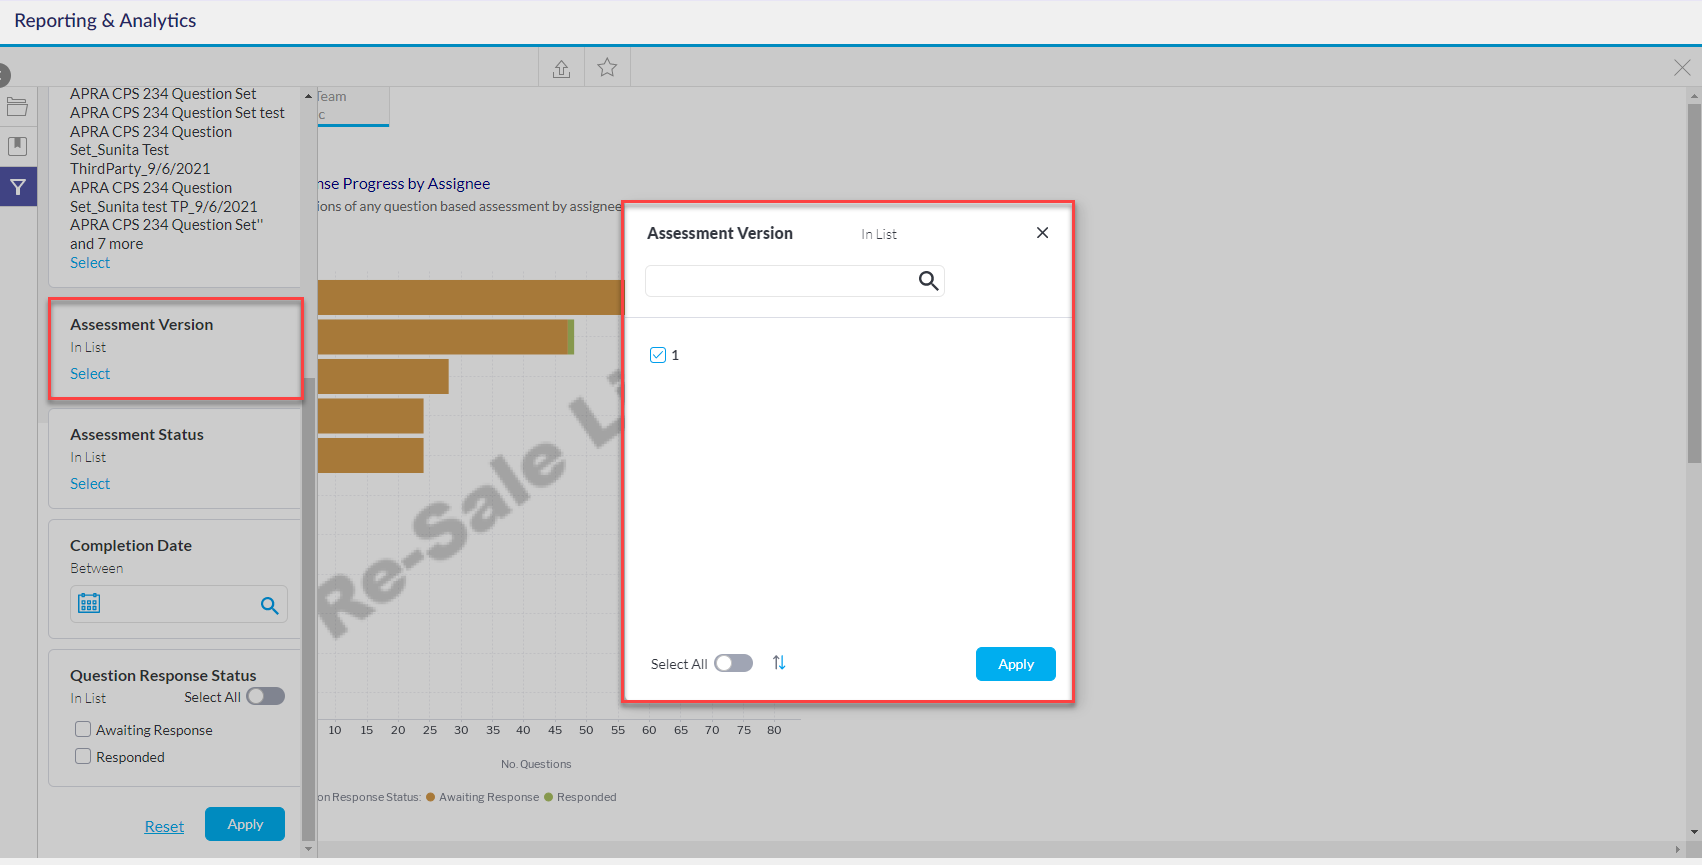
- Assessment Verison - Select the version of the assessment. Slide the Select All toggle to select all options available. Click Apply to apply selection.
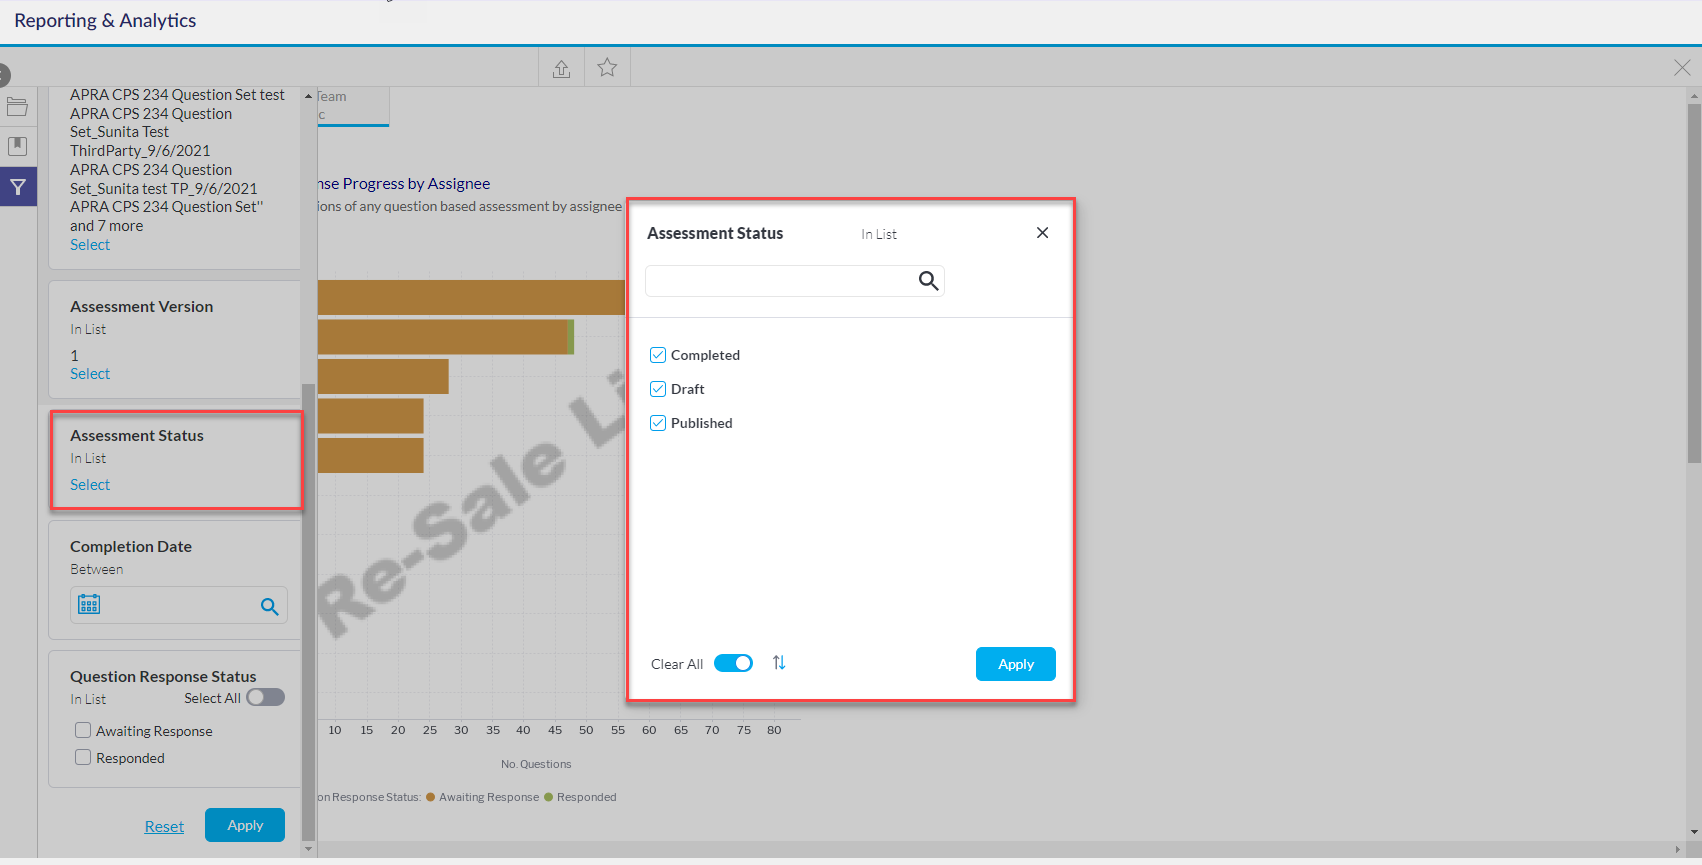
- Assessment Status - Select the stage in which the assessment is in. Slide the Select All toggle to select all options available. Click Apply to apply selection.
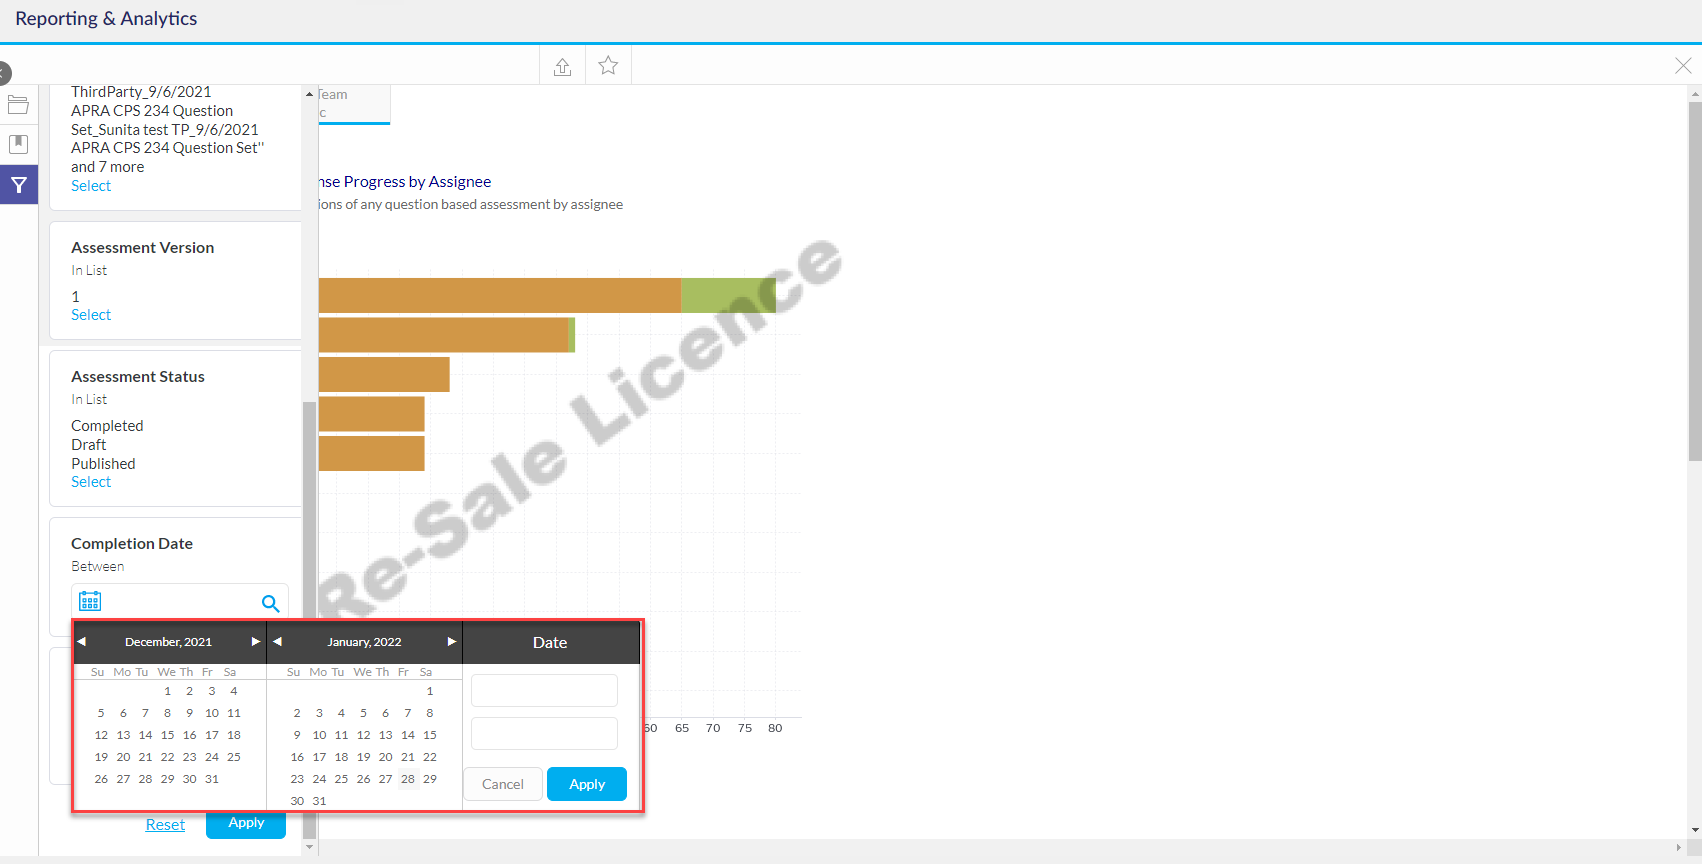
- Completion Date - Select the date or date range from the calendar. The date or date range can also be typed into the boxes under the Date field.
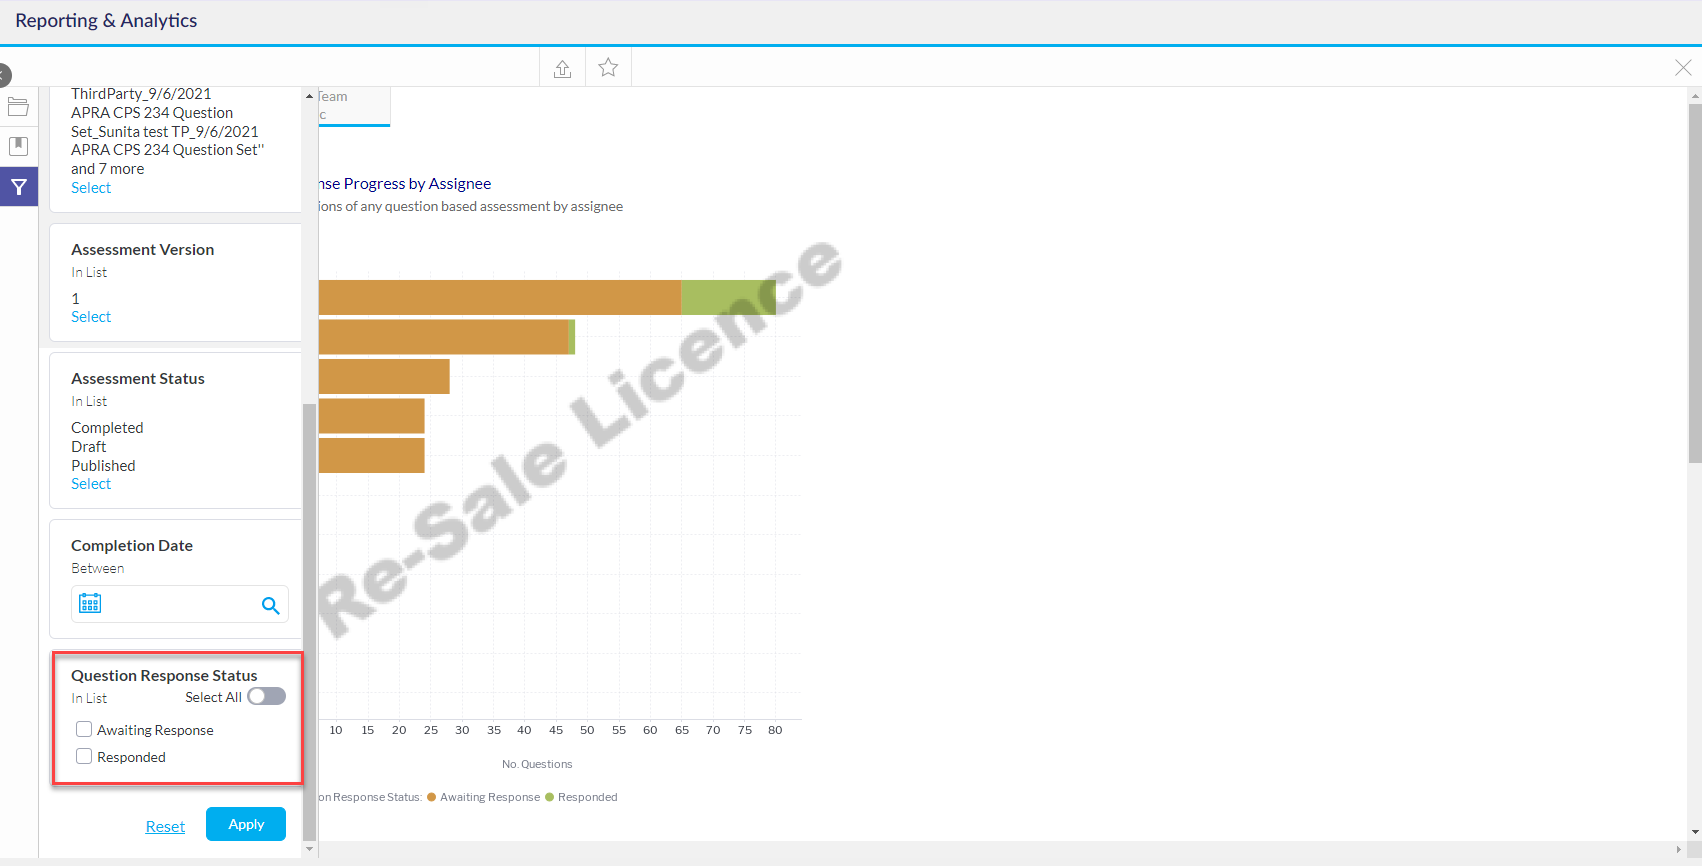
- Question Response Status - Select the question response status from the multi-option list. Slide the Select All toggle to select all options available. Click Apply to apply selection.
After all filter selections have been chosen, click the Apply button. Click Reset to remove all filter selections and start the filter selection process from the start.
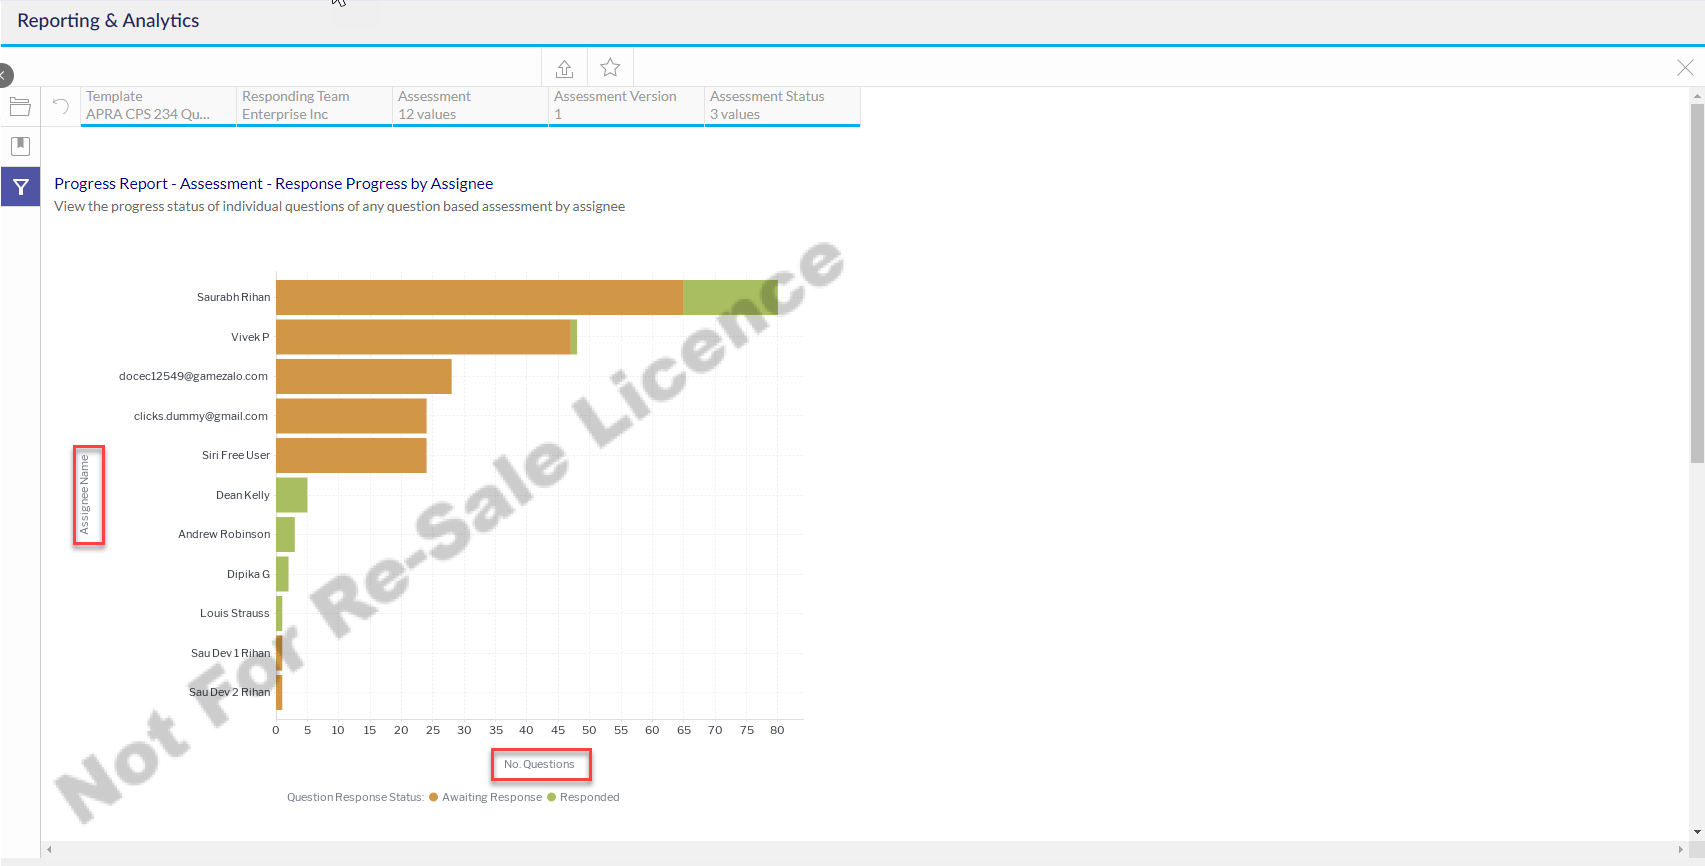
The assessment report results will populate. The results will appear in a bar chart, displaying the assignee names on the Y-axis and the number of questions on the X-axis.
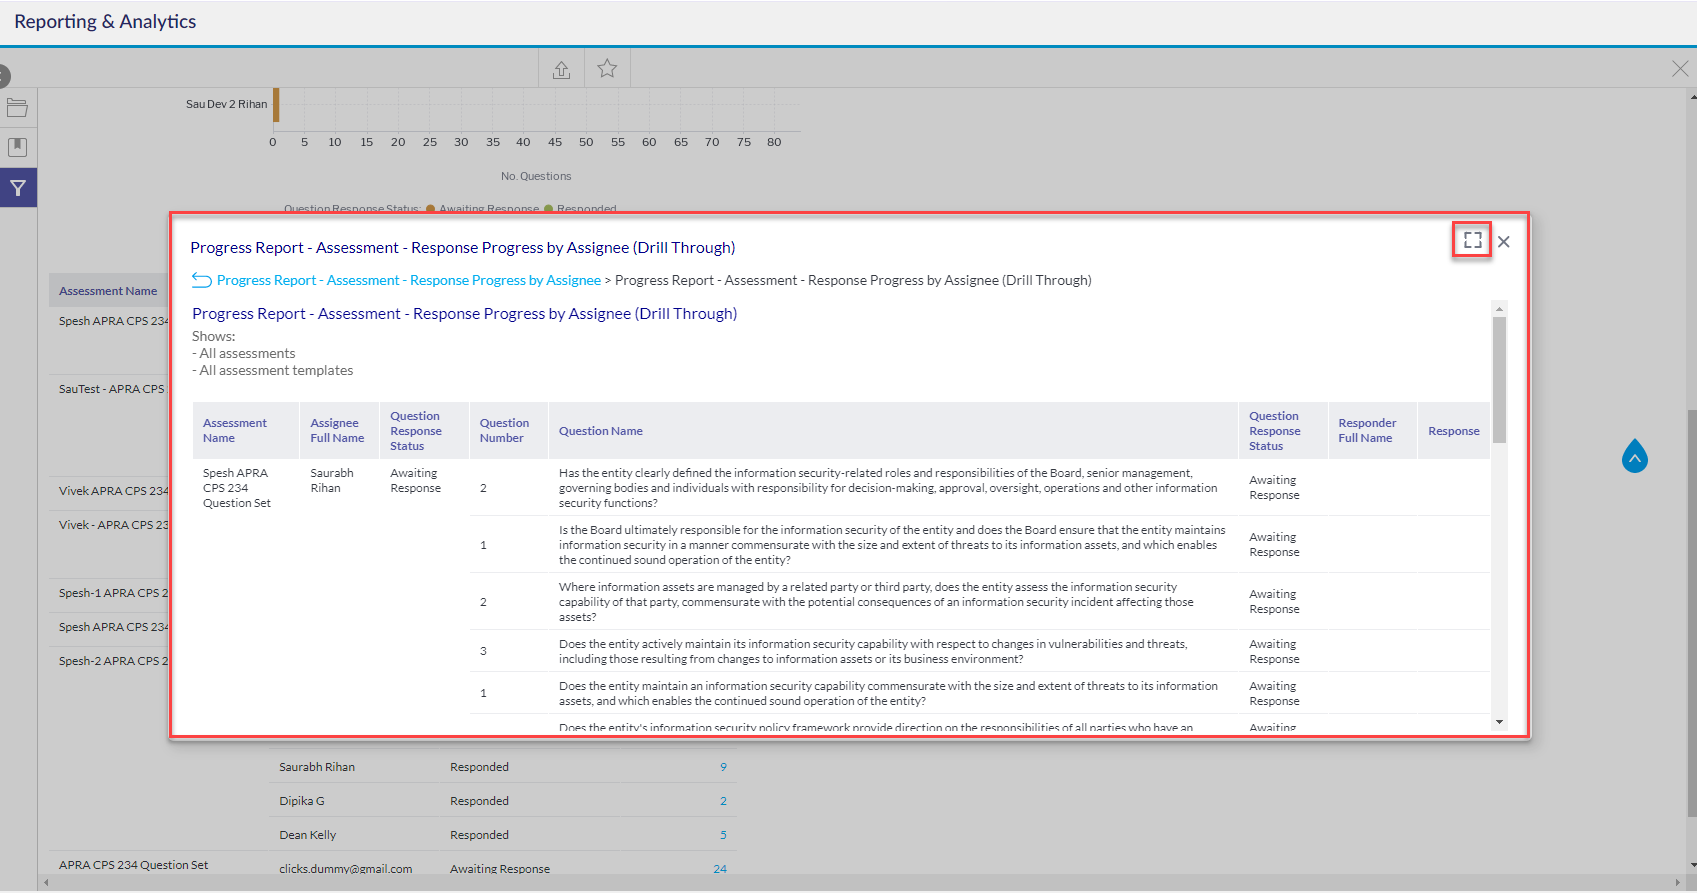
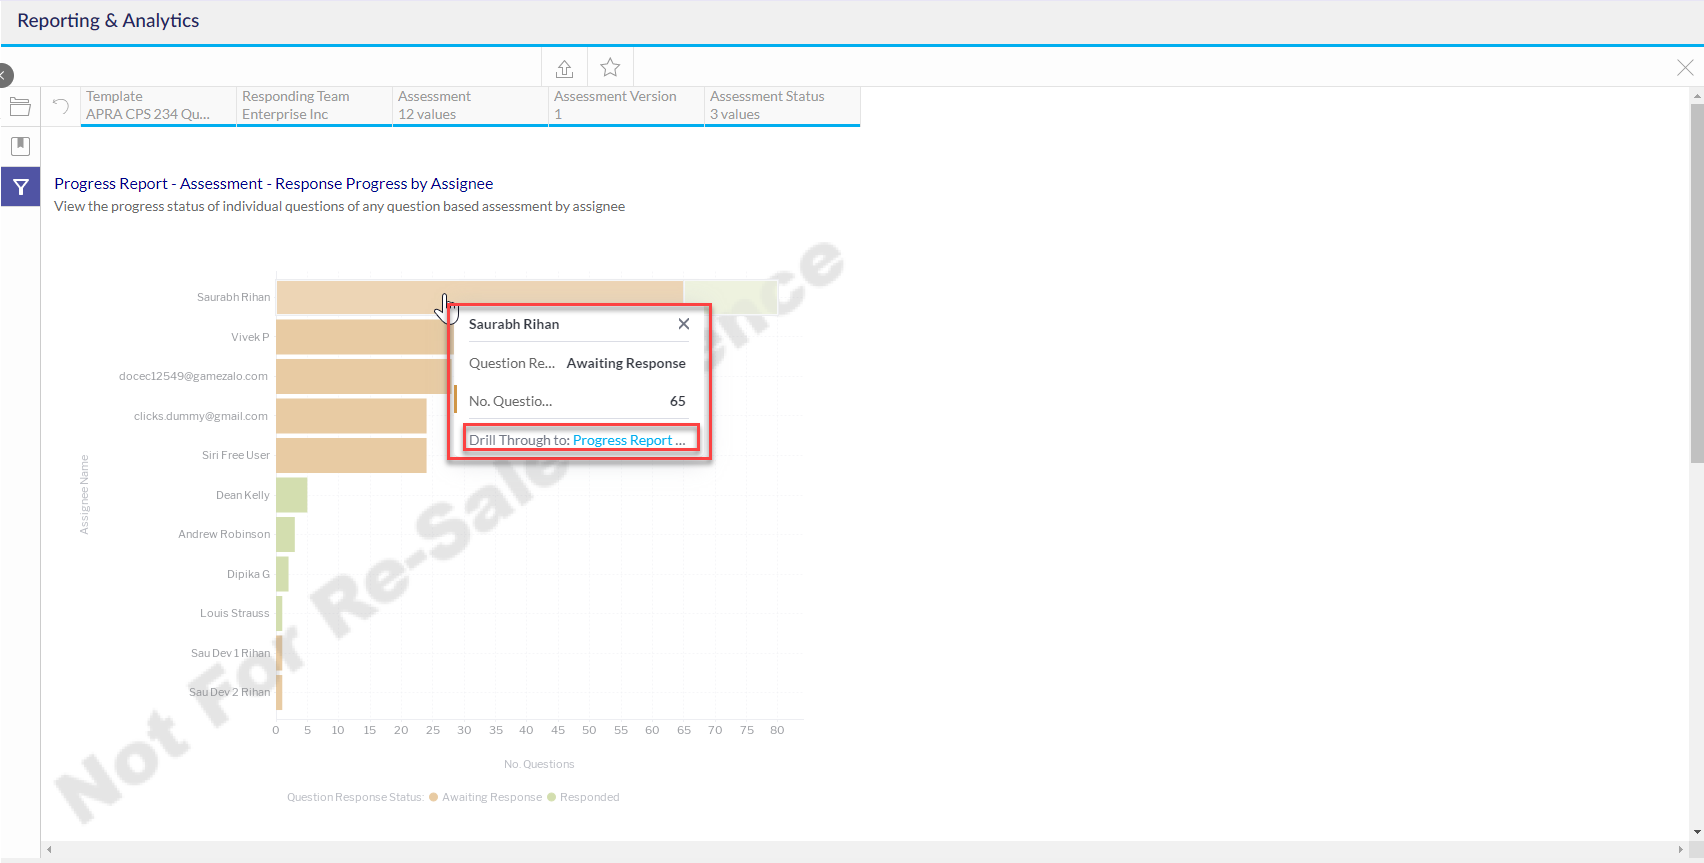
Hovering over each bar in the bar chart shows an overview of the information the bar is representing. By clicking the bar, a modal will appear. This allows the user to drill through to the assessment.
The assessment modal shows the bar chart in a table view. The square allows the user to view the assessment table in a full-screen view.
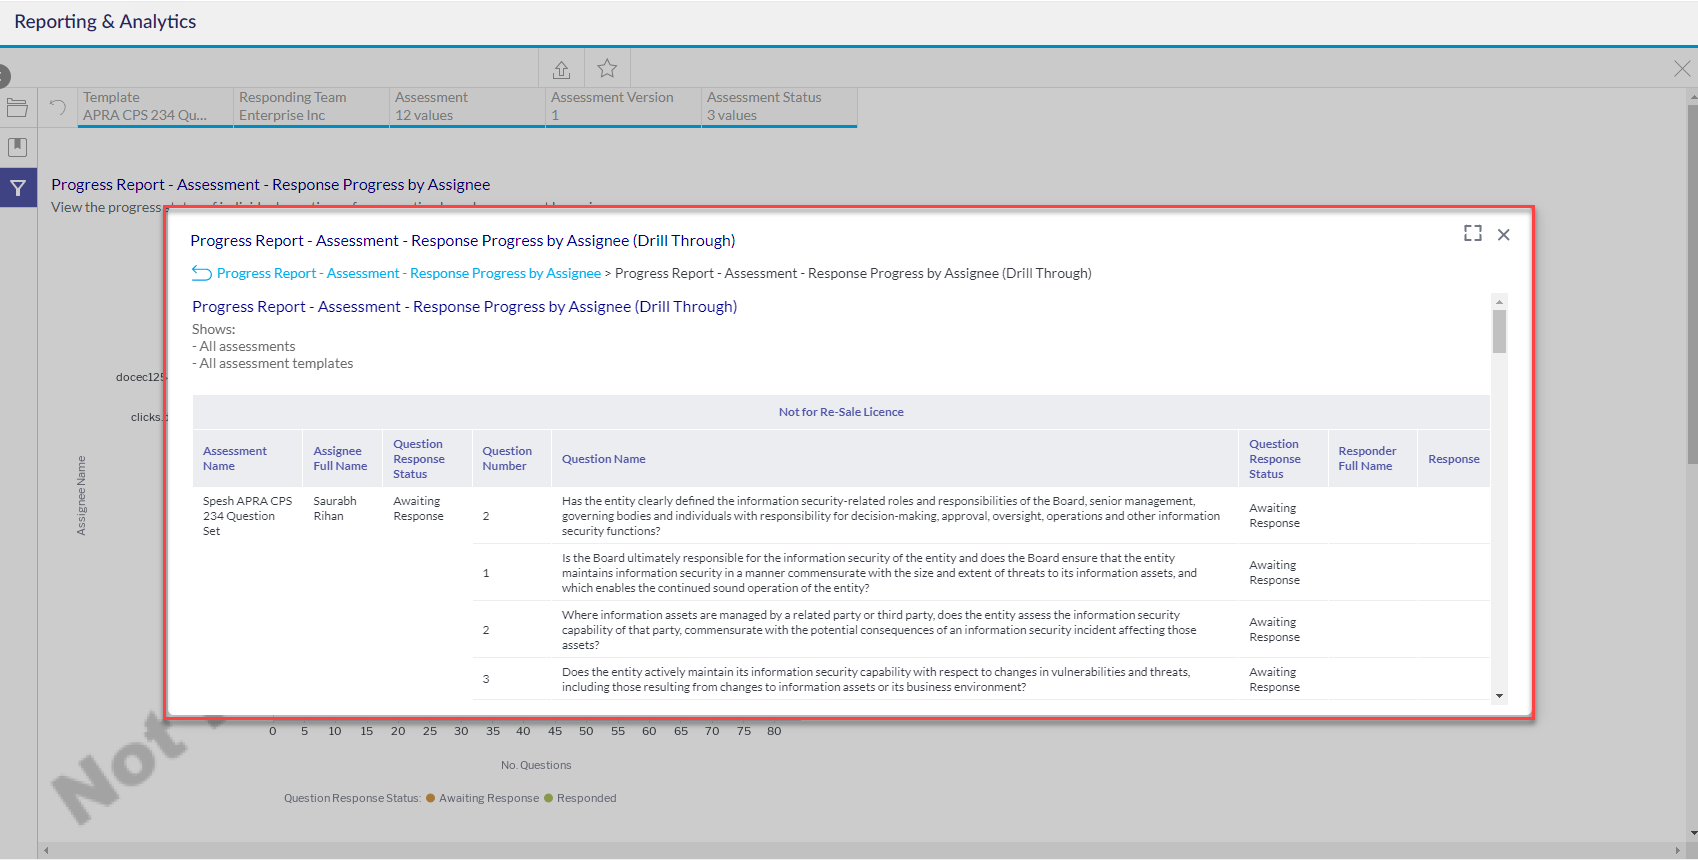
The table below also has the drill-through capability. Click on the blue number within the table to drill through to the respective section of the assessment.
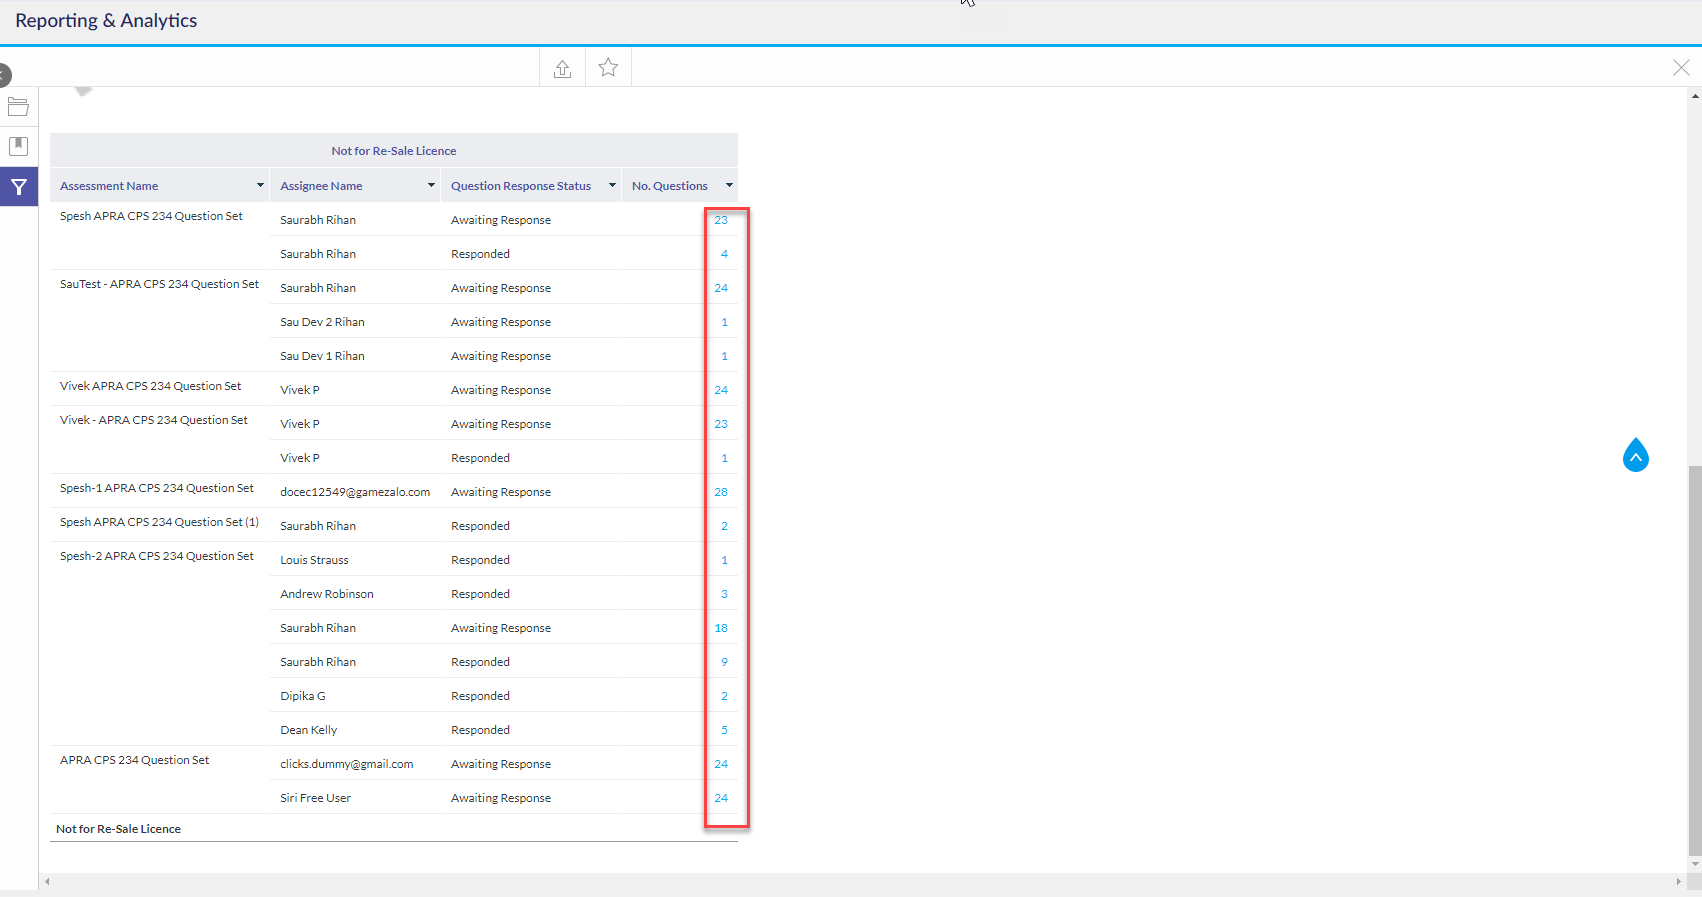
A modal will appear showing the assessment in a table format. Clicking the square will enlarge the table to full screen.